Try it on your own data
Every report in this article is in the free plan. One snippet for web and apps, up to 10 sites.
Start freeTo choose between heatmap tools, score them on eight things: click placement, friction clicks, scroll depth, dynamic pages, device split, sampling, privacy defaults and billing meter. Features look alike; sampling rate and the meter decide whether low-traffic pages are readable and what you pay when traffic doubles.
What you will learn
- Score each tool 0–2 on eight criteria from its documentation; a 0 on privacy defaults rules it out on sites with forms
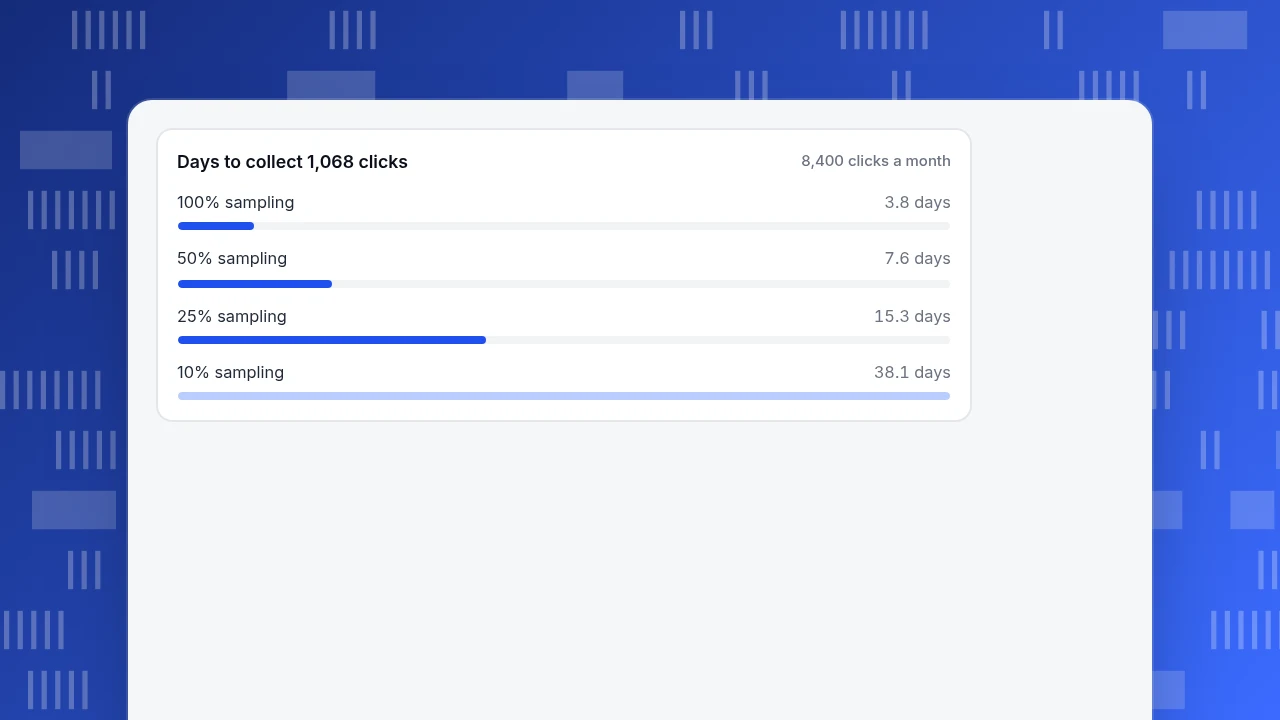
- About 1,068 clicks on a page give a ±3 point margin; at 10% sampling a page with 8,400 clicks a month needs 38 days
- The billing meter matters more than the headline price: in the sample, doubling traffic took one plan from $60 to $90 and the other from $80 to $160
What should a heatmap tool tell you?
A heatmap tool answers one question: where on a page do visitors click and how far do they scroll? Before you compare vendors, decide which of the four common map types you need, because tools differ most in which of them they draw well.
Scroll maps matter because attention drops quickly down a page. In a 2018 eye-tracking study of 120 participants and more than 130,000 fixations, Nielsen Norman Group found that people spent 57% of their viewing time above the fold, 74% within the first two screenfuls and 81% within the first three. A scroll map shows whether your visitors look like that on your page, or whether the content you care about sits below the point where most of them leave.
The table below pairs each map with the question it answers and the way it is most often misread.
| Map | Question it answers | Common misread |
|---|---|---|
| Click map | Which elements do people try to use? | Reading a hot spot as success; a hot non-link is a dead-click clue |
| Rage clicks | Where do people get stuck? | Treating one impatient visitor as a trend |
| Scroll map | How far do people read? | Using an average depth instead of the share reaching each depth |
| Elements | Which controls get which share of clicks? | Comparing a footer link with a hero button without allowing for position |
Rage-click definitions differ by tool; check the one you use before comparing counts.
The criteria checklist: eight things to compare
Most comparison pages rank products. A checklist is more useful, because the right tool depends on your traffic and your page types. Score each tool 0 (fails), 1 (partly) or 2 (passes) on the questions below, using the vendor's documentation rather than the marketing page.
| # | Criterion | Question to ask | Pass rule |
|---|---|---|---|
| 1 | Click map | Does it place clicks on the full page, or only the visible viewport? | Clicks are stored with document coordinates, not only viewport coordinates |
| 2 | Friction clicks | Does it flag repeated clicks on the same spot? | The definition of a rage click is published (number of clicks, time, distance) |
| 3 | Scroll depth | Is the scroll map the share that reached each depth, or an average? | Each row is a share of visits that reached that depth or further |
| 4 | Dynamic pages | Do menus, modals and single-page-app routes get their own data? | You can test it on your own page in a trial |
| 5 | Device split | Can you view desktop, mobile and tablet separately? | Separate views, plus a viewport-width filter |
| 6 | Sampling | What share of visits is recorded, and who decides? | The rate is visible and you can set it per project |
| 7 | Privacy | What is never captured, and is there an exclusion list? | Password fields and input values are skipped by default; you can exclude paths |
| 8 | Price model | What does the meter count: pageviews, sessions or recordings? | You can predict next month's bill from your analytics |
A total of 13 or more out of 16 is a reasonable bar for a tool you will rely on. Anything with a 0 on criterion 7 should not go on a site that handles forms, whatever its total.
How many clicks does a heatmap need before you trust it?
A heatmap is a sample, and a sample has an error margin. For the share of clicks that land on one element, the margin of error at 95% confidence is about 1.96 × √(p × (1 − p) ÷ n). The worst case is p = 0.5, which gives the number of clicks you need for a target margin: n = 1.96² × 0.25 ÷ E². The method is the standard proportion confidence interval described in the NIST/SEMATECH e-Handbook of Statistical Methods.
| Target margin (±) | Clicks needed on the page |
|---|---|
| 10 points | 97 |
| 5 points | 385 |
| 3 points | 1,068 |
Now put a sampling rate on it. Sample data: a pricing page gets 6,000 views a month with 1.4 tracked clicks per view, so 8,400 clicks a month. To reach 1,068 clicks you wait:
- at 100% sampling: 1,068 ÷ 8,400 × 30 = 3.8 days
- at 50%: 7.6 days
- at 25%: 15.3 days
- at 10%: 38.1 days
The same 3-point margin takes five weeks on a 10% sample. This is why sampling is a criterion and not a footnote: a low default rate that cannot be raised makes low-traffic pages unreadable. Pages with fewer than about 400 clicks a month are better read with session recordings than with a heatmap.
Days to collect 1,068 clicks
8,400 clicks a monthWhat should a heatmap tool never capture?
A heatmap records clicks, which can include clicks on form fields, account pages and anything a visitor types around. In the EU and UK three principles of the GDPR (Article 5) apply directly: personal data must be collected for specified purposes, limited to what is necessary (data minimisation), and kept identifiable for no longer than necessary (storage limitation). Turn those into four checks:
- Input values. Password fields and typed values must be skipped or masked by default. Treat a tool that makes you opt in to masking as a fail.
- Element text. Capturing the label of a clicked button can capture a name or an email shown on the page. Prefer tools where text capture is off by default.
- Exclusions. You need path rules and element rules, for example never record
/checkout/*or an element carrying a no-record attribute. - Retention. The number of days is a setting you control, and deleting a page's data takes one click.
Consent is a legal decision for your own advisers, not a feature to compare. What you can compare is whether the tool respects your privacy configuration, for instance by not running at all when the consent state does not allow it.
How does the price model change your bill?
The meter decides the cost more than the headline price. Sample data: a site with 120,000 pageviews and 40,000 sessions a month. Plan A bills $30 per 100,000 recorded pageviews and lets you choose which pages to record. Plan B bills $40 per 25,000 sessions, whatever the pages. Both bill in whole blocks.
| Scenario | Plan A (pageviews) | Plan B (sessions) |
|---|---|---|
| All pages, today | 2 blocks = $60 | 2 blocks = $80 |
| 3 key pages only (36,000 pageviews) | 1 block = $30 | still 2 blocks = $80 |
| 50% sampling | still follows pages | 20,000 sessions = 1 block = $40 |
| Traffic doubles, all pages | 240,000 → 3 blocks = $90 | 80,000 → 4 blocks = $160 |
Neither plan is better in general. A pageview meter rewards you for recording fewer pages; a session meter rewards sampling. Ask which of the two you can control, then check that an overage is a bill and not a silent stop in recording.
Does it work on dynamic pages and different devices?
Run a 20-minute trial on your own site, not the vendor's demo. Pick the page with a sticky header, a pop-up and a long scroll, then check:
- Click a menu item that opens a dropdown. Does the click land on the item or on the page behind it?
- Open a modal and click inside it. Is that click tied to the modal, or to the content underneath?
- On a single-page app, navigate to two routes and see whether each appears as a separate page in the page list.
- Resize the browser to a phone width and click again. Is the click filed under mobile, and can you filter by width?
- Check what the overlay uses as a background. Some tools store a picture of the page; others load the live URL, which fails if the page cannot be framed or has changed since.
If any of the five results is wrong on your site, the tool will mislead you on that page type.
When is a heatmap not enough?
A heatmap shows the sum of many visits; a recording shows one visit. Use the heatmap to find the page and the spot, then a few recordings to see what the visitor did before and after the click. Compare recorders in session replay tools and read the colours in how to read a heatmap. Two rules of thumb:
- If rage clicks cluster on one element, watch five recordings that contain a rage click before you change anything.
- If a scroll map shows a steep drop at one depth, check the page height by device first: the same content sits at different depths on a phone and a laptop.
How does TapCub measure up against the checklist?
Here is the checklist applied to TapCub's own heatmaps, using its documentation. This is a description of what is there, not a ranking.
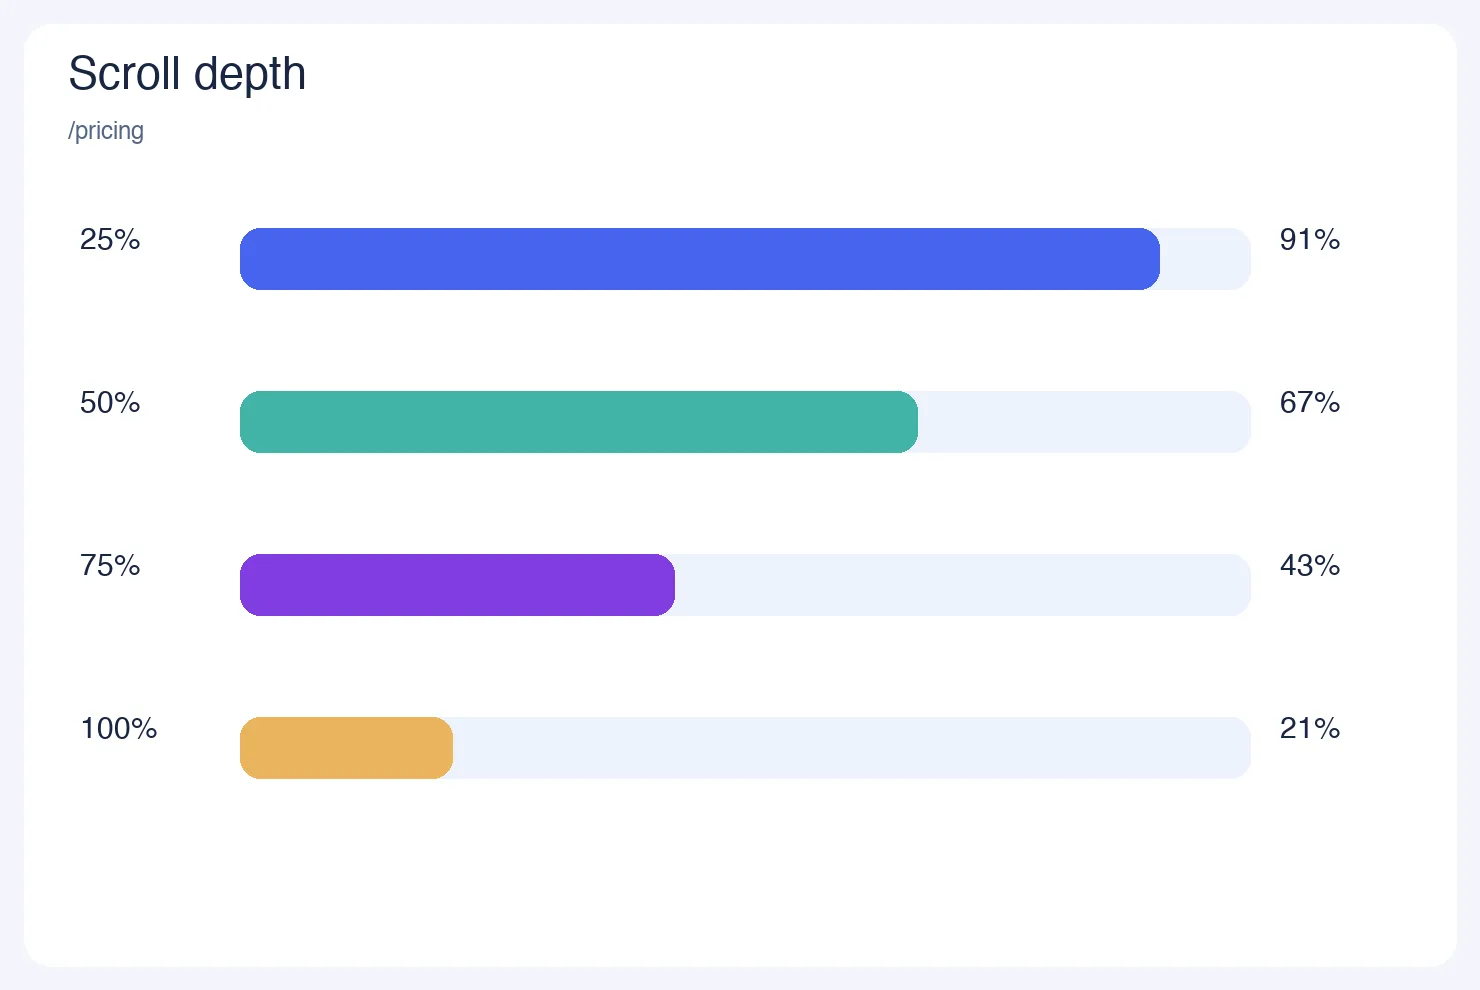
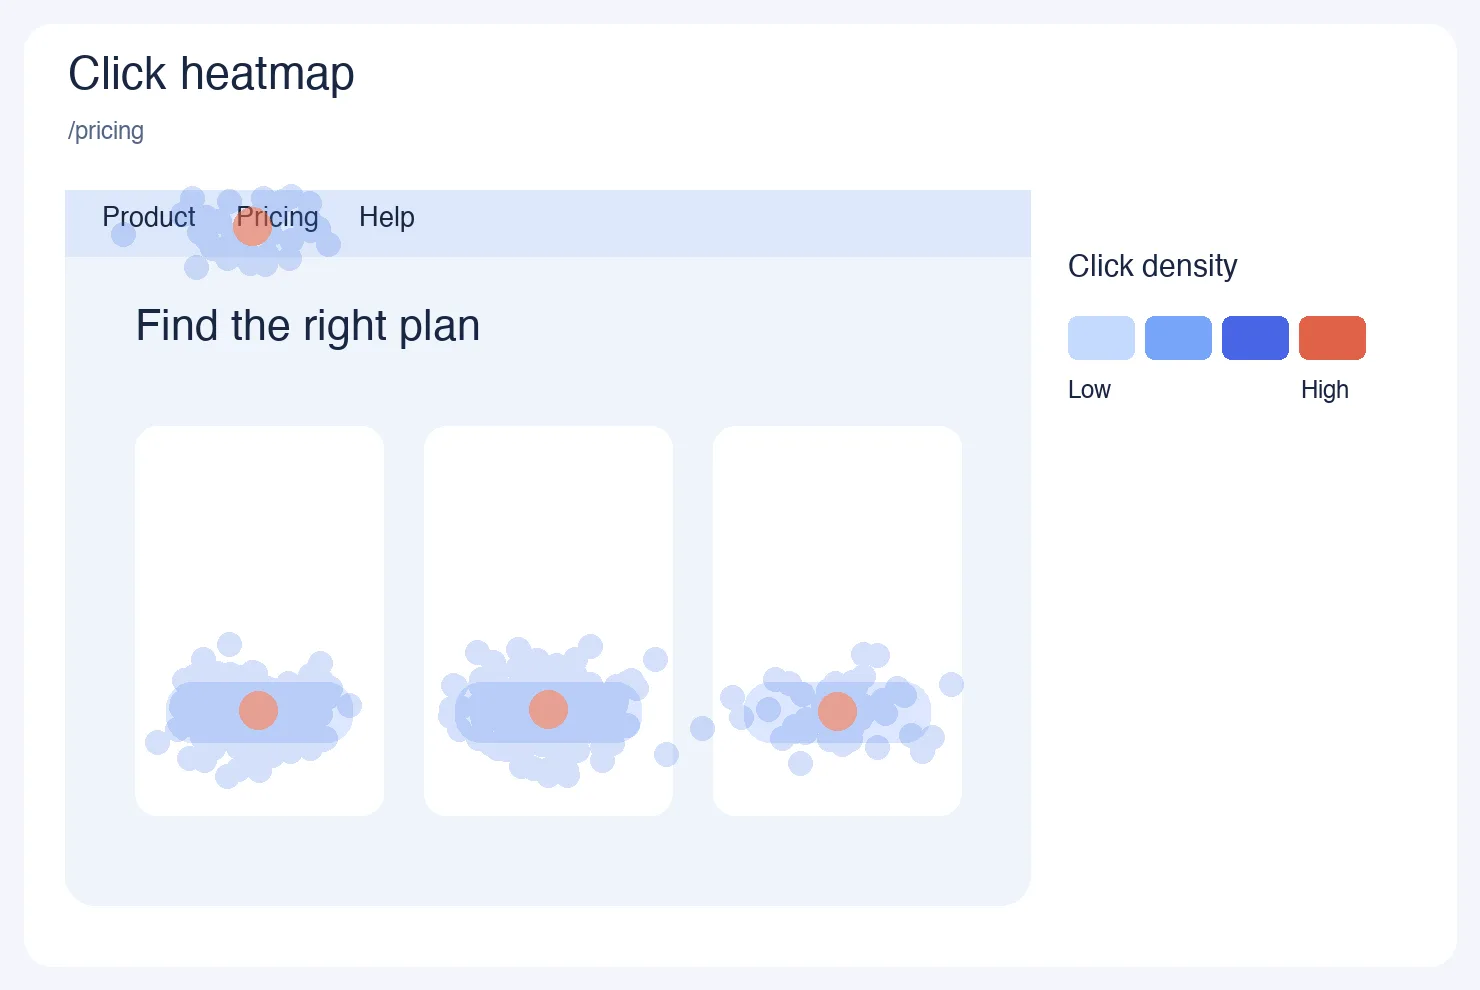
- Switch it on. Heatmaps need autocapture, which is on the Pro plan or higher. The switch, scroll depth, element text, sample rate, retention, page scope and skipped elements all sit on one card (criteria 3, 6, 7).
- Set scope. Use paths to capture or skip, with
*as a wildcard such as/product/*. Password fields, anything underdata-tc-ignore, the support widget and your deny-list selectors are skipped. Element text is off by default. Sampling is stable per device (criteria 6, 7). - Read it. Open All-platform analytics › Behavior › Heatmaps, pick a page row and a device (all, desktop, mobile, tablet), then use the tabs Clicks, Rage clicks, Scroll reach and Elements. Each scroll row is the share of visits that reached that depth or further (criteria 1, 3, 5).
- Know the rules. A rage click is the third click within 300 milliseconds and 50 pixels, decided in the collector. Clicks without document coordinates cannot be placed on the full page, and the chart says so (criteria 1, 2).
- Know the limits. Date range is up to 92 days; there is no metric row, breakdown or compare period; people counts are distinct visitors. TapCub does not store a picture of the page, so the overlay needs a URL you can still open. TapCub does not run A/B tests, so a heatmap finding is a hypothesis to fix and re-measure.
Session replay is a separate page, off by default, with a 10% sample rate and 30-day retention as defaults.
FAQ
What is a heatmap tool?
A heatmap tool records where visitors click, tap, move and scroll on a page, then draws the totals as colour from cool to hot. It shows what people do in aggregate, not why. Pair it with recordings or a funnel to find the cause.
Which heatmap types do I need?
Start with click and scroll maps. They answer the two most useful questions: what do people try to use, and how far do they read. Add rage-click and element views when you see friction. Movement and attention maps are harder to act on.
How much traffic is enough for a heatmap?
Count clicks, not visitors. About 400 clicks on a page gives a margin of roughly ±5 points on any element's share, and about 1,070 gives ±3. Under that, read recordings instead.
Do heatmaps slow a website down?
They add a script and send small batches of events, so there is a cost, but it is usually small. Check it yourself: measure Largest Contentful Paint before and after on the same page, and lower the sample rate if it moves.
Are heatmaps allowed under GDPR?
Heatmaps can be run lawfully, but they process personal data if they identify visitors, so the Article 5 principles apply: purpose, minimisation and storage limitation. Mask inputs, exclude sensitive pages, set a retention period, and take advice on consent for your own situation.
Sources
- Nielsen Norman Group, Scrolling and Attention (April 2018): 57% / 74% / 81% of viewing time, 120 participants.
- NIST/SEMATECH e-Handbook of Statistical Methods, Confidence interval for a proportion, checked 2026-11-20.
- Regulation (EU) 2016/679, Article 5, principles relating to processing of personal data, checked 2026-11-20.
Was this article helpful?
We use your answers to fix and expand this page.
Couldn’t send. Please try again in a minute.
Thanks for the feedback. We’ll use it to improve this page.You’ve already sent feedback on this page. Thanks.

Data Engineer
Writes about event design, data quality, and collection workflows, with verifiable implementation methods for reliable analytics.