Try it on your own data
Every report in this article is in the free plan. One snippet for web and apps, up to 10 sites.
Start freeSocial commerce is selling products through social platforms, either with checkout inside the app or through posts, creators and live streams that send people to your shop. The hard part is attribution: untagged social visits often land as direct. Below: five models, a tagging example that moves social from 12.0% to 37.3% of orders, and the economics.
What you will learn
- The place the sale happens decides whose data records it: in-app sales stay in the platform report
- Untagged social traffic lands as direct; tagging every link you control moves it to the right row
- Judge creator spend on gross margin, not revenue: 1.58 revenue return was 0.63 on margin
What is social commerce?
Social commerce is selling products through social platforms, either by letting people buy inside the platform or by using posts, creators and live streams to send them to a shop. There is no single standard definition: some writers count only purchases completed inside the social app, others include any sale that starts with a social post. For measurement the difference matters, because the place where the purchase happens decides whose data records it.
It is not the same as social media marketing, which builds awareness and traffic without a purchase path, or social selling, where a salesperson builds relationships on social networks. Social commerce is about the path from a post to an order. The measurement problem sits on that path, and the rest of this guide is about solving it. For the wider store metrics, see ecommerce analytics.
What are the main social commerce models?
The model decides what you can measure yourself. Five common ones:
| Model | Where the purchase happens | What your own analytics can see |
|---|---|---|
| In-app checkout | Inside the social platform | Nothing; only the platform's report |
| Shoppable posts or shop pages that link out | Your website or app | The visit, if the link carries a source |
| Live shopping | Inside the platform or on your site | Visits from links in the stream; not in-stream sales |
| Creator or affiliate links | Your website | Visits and orders, if each creator has a tagged link |
| Messaging or chat sales | In a chat, then off-platform payment | Only what the buyer later does on your site |
Notice the pattern: the further the sale stays inside the platform, the less you can see. So decide per model which numbers come from the platform report and which come from your own site, and never add the two without checking for overlap.
| Parameter | Rule | Example value |
|---|---|---|
| utm_source | The platform, lower case | |
| utm_medium | The kind of placement | creator, bio-link, story, live |
| utm_campaign | The campaign or drop | spring-drop |
| utm_content | One value per creator or post | creator-ana |
Values are case-sensitive; agree the names in a shared sheet before launch.
Why is social commerce so hard to measure?
Three things break the chain from post to order:
- Walled gardens. In-app sales and views are reported by the platform in its own definitions.
- Links that lose their source. Visits often arrive from in-app browsers, messaging apps and copied links that pass no referrer, so the visit lands as "direct". This is the problem described in dark social.
- Last-click credit. The order is credited to the final visit, which may be a direct return after a social introduction days earlier.
The practical effect is that social looks smaller than it is and "direct" looks bigger and better than it is. The fix is cheap and old: put a labelled source on every link you control, as in UTM.
What does untagged social traffic look like?
Sample data: one week of a store's traffic, before and after tagging every creator link with campaign parameters. Sessions are the same; only the labelling changes.
| Source | Before: sessions | Before: orders | After: sessions | After: orders |
|---|---|---|---|---|
| Direct | 3,700 | 112 | 1,800 | 36 |
| Social, referrer only | 1,800 | 36 | 1,800 | 36 |
| Social, tagged creator links | 0 | 0 | 1,900 | 76 |
| Search | 3,000 | 90 | 3,000 | 90 |
| 700 | 42 | 700 | 42 | |
| Other | 800 | 20 | 800 | 20 |
| Total | 10,000 | 300 | 10,000 | 300 |
Read it like this:
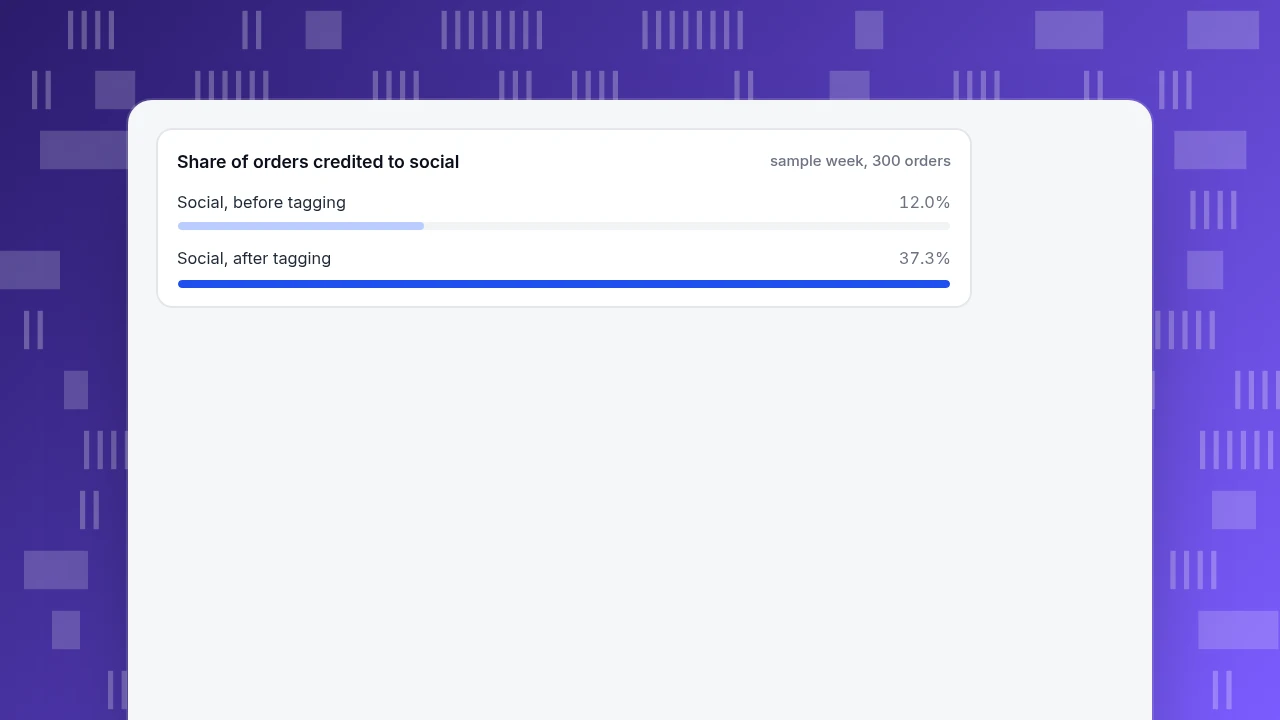
- Before tagging, direct converts at 112 ÷ 3,700 = 3.0% and social shows only 36 orders: 36 ÷ 300 = 12.0% of all orders.
- After tagging, 1,900 direct sessions turn out to be social. Direct converts at 36 ÷ 1,800 = 2.0%, the tagged creator links convert at 76 ÷ 1,900 = 4.0%, and social in total has 36 + 76 = 112 orders, or 112 ÷ 300 = 37.3% of orders.
Nothing about the shop changed. The same orders are simply put in the right row. A team looking at the "before" table would cut social and credit direct; the "after" table says the opposite.
Share of orders credited to social
sample week, 300 ordersHow should you tag social links?
Use the standard campaign parameters. Google's documentation lists five: utm_source, utm_medium and utm_campaign are required, utm_term and utm_content are optional, and values are case-sensitive, so utm_source=Instagram and utm_source=instagram count as different sources.
A naming convention that keeps reports clean:
| Parameter | Rule | Example value |
|---|---|---|
utm_source | The platform, lower case | instagram |
utm_medium | The kind of placement | creator, bio-link, story, live |
utm_campaign | The campaign or drop | spring-drop |
utm_content | One value per creator or post | creator-ana |
Rules that save the data:
- One link per creator and per placement. Reusing a link merges people you want to compare.
- Lower case, hyphens, no spaces, written in a shared sheet before launch.
- Tag only links that leave your property. Never tag links between your own pages, because it overwrites the real source mid-session.
- Test each link by clicking it and checking the visit appears under the right source.
- Disclosure is separate from tracking. The FTC tells people who endorse products that a free product or payment is a relationship that must be clearly disclosed, close to the endorsement; build that into your creator brief.
What is social commerce actually worth?
Tagged orders let you price the channel. Sample data: you paid creators $2,400 in the week; the tagged links produced the 76 orders above, with a $50 average order and a 40% gross margin.
| Measure | Calculation | Result |
|---|---|---|
| Cost per order | 2,400 ÷ 76 | $31.58 |
| Revenue return | 76 × 50 = 3,800; 3,800 ÷ 2,400 | 1.58 |
| Gross margin | 3,800 × 40% | $1,520 |
| Margin return | 1,520 ÷ 2,400 | 0.63 |
Revenue looks healthy at 1.58, but margin return is 0.63: each $1 spent returns $0.63 of margin on the first order, so the channel only pays if buyers come back. Check repeat purchases for those customers before cutting or scaling. Decide on margin, not revenue.
What can you not measure, and how do you cope?
- In-platform sales. Read the platform's report, and reconcile against your order system: total orders = orders from your site + in-platform orders. If the sum is far off, something is double-counted.
- Views, saves and shares. They are real signals but belong to the platform; do not mix them into your site's session counts.
- Residual dark social. Even with tagging, copied links and messages still arrive as direct. Treat direct as "unknown, partly social" and watch its trend.
- Cross-device paths. A person may discover on a phone and buy on a laptop; unless they log in, those are two people.
What should a weekly social commerce report answer?
Keep it to five questions, each with one number and one source, so the report can be read in two minutes:
| Question | Number | Where it comes from |
|---|---|---|
| Is social bringing visitors? | Sessions by medium (creator, bio-link, story, live) | Your site analytics, tagged links |
| Are they buying? | Conversion rate and orders per medium | Your site analytics, order goal |
| Is it paying back? | Cost per order and margin return | Spend sheet plus order values |
| Who works? | Orders per creator (utm_content) | Your site analytics |
| What happens inside the app? | Orders, refunds, returns | The platform report, reconciled to your order system |
In the sample week the report would read: 1,900 tagged sessions, 4.0% conversion, $31.58 per order, a 0.63 margin return, and one creator link worth following up. Add a line for what changed since last week and what you will do about it. If a number has no action attached, remove it.
Which mistakes distort social commerce reports?
- Judging social from last click alone. In the example it showed 12.0% of orders; the real figure was 37.3%.
- Tagging internal links. It overwrites the true source.
- Inconsistent capitalisation. Two spellings split one source in two.
- Adding platform and site numbers. In-app orders and tracked orders can overlap.
- Ignoring margin. A 1.58 revenue return was a 0.63 margin return.
- Using one link for all creators. You lose the comparison that tells you who works.
How do you measure social commerce in TapCub?
Take the store above. TapCub measures what reaches your website or app; it is not an ad-buying tool and does not match installs.
- Tag the links with the parameters in the naming table. TapCub reads them as visitors arrive.
- Read the sources. Web analytics › Sources classifies traffic by channel using UTM, source domain and click identifiers; your own channel rules take priority over defaults. The UTM tab splits source, medium, campaign, term and content, with visitors, sessions, views, bounce and time per row, and the channel table includes conversion. Direct and in-site referrals are kept apart.
- Define the order as a goal. Use Web analytics › Goals so each source row shows conversions.
- Add spend. In All-platform analytics › Business › Channel ROI, import spend by day, channel, source and campaign, by CSV or entry by entry. TapCub then shows cost per click (spend ÷ sessions), cost per order (spend ÷ purchases in orders) and return on ad spend, grouped by channel, source or campaign. That produces the $31.58 and 1.58 rows. Add the margin step yourself.
- Check who assists. In All-platform analytics › Behavior › Behavior analysis, attribution lets you choose first-touch, last-touch, linear, position and time-decay models side by side, so a platform that introduces buyers but rarely gets the final click stands out.
TapCub cannot see inside a platform's own checkout, so in-app sales stay in the platform's report; compare the two totals yourself.
FAQ
What is social commerce?
Social commerce is selling products through social platforms, either with checkout inside the app or by using posts, creators and live streams that send people to your shop. Definitions differ on whether the sale must be completed in the app.
What is the difference between social commerce and social media marketing?
Social media marketing builds awareness and traffic; social commerce adds a purchase path from the post. The measurement difference is that social commerce needs orders credited to the social source, not just clicks, likes or reach.
How do you track social commerce sales?
Put a tagged link on every creator, post and bio link, set up an order goal, then read orders by UTM source and campaign. For in-app checkout, use the platform's report and reconcile against your order total.
Why does social traffic show up as direct?
In-app browsers, messaging apps and copied links often pass no referrer, so the visit has no source and is filed as direct. Tagging links with UTM parameters, as in the example, brings most of it back.
How do you measure the ROI of creator marketing?
Divide spend by tagged orders for cost per order, then compare gross margin on those orders with spend. In the sample, a 1.58 revenue return was only 0.63 on margin, so repeat purchases would decide whether it pays.
See also: Shoppable Content Examples and How to Track Revenue From Each.
Sources
- Google. Collect campaign data with custom URLs. The five campaign parameters, which are required, and case sensitivity.
- Federal Trade Commission. Disclosures 101 for Social Media Influencers. Relationship disclosure for endorsements, including free products.
Was this article helpful?
We use your answers to fix and expand this page.
Couldn’t send. Please try again in a minute.
Thanks for the feedback. We’ll use it to improve this page.You’ve already sent feedback on this page. Thanks.

Product Analyst
Focuses on event analysis, conversion funnels, and retention, using clear metric definitions and structured analysis to explain product performance.