Try it on your own data
Every report in this article is in the free plan. One snippet for web and apps, up to 10 sites.
Start freeStartup marketing is the work of finding a few repeatable ways to reach customers while money, time and brand are limited, and the practical rule is to run three channels in depth rather than ten at once. A small budget spread over many channels gives counts too small to read. Below: the growth math, a channel scoring sheet and a four-week budget example.
What you will learn
- Three channels with fixed four-week tests give readable results; ten give counts of about 3 that swing ±58%
- Judge channels by cost per activated user, not per signup; in the sample the ranking reversed
- Change one channel's budget at a time, and only when the gap exceeds the random swing
What should startup marketing achieve first?
Startup marketing has one early job: to find one or two repeatable ways of reaching the people who need your product, and to make the weekly count of those people go up. It is not brand building and it is not a content calendar. Paul Graham's essay "Startup = Growth" gives the yardstick: a good rate during Y Combinator was 5-7% a week, 10% a week was exceptional, and 1% a week suggested the founders had not yet worked out what the company was doing.
Weekly rates sound small until they compound over a year of 52 weeks:
| Weekly growth | Multiple after 52 weeks | Weeks to go from 100 to 1,000 users |
|---|---|---|
| 1% | 1.68× | 231 |
| 5% | 12.64× | 47 |
| 7% | 33.73× | 34 |
| 10% | 142.04× | 24 |
Sample data: the same starting count of 100 users, with only the weekly rate changed. The table is plain arithmetic: 1.05 to the 52nd power is 12.64, and the weeks column is ln(10) ÷ ln(1 + rate).
The same essay and a second one, "Do Things that Don't Scale", make the starting point concrete: early users rarely arrive by themselves, so founders often have to recruit the first ones by hand. That is the stage this guide covers, with one rule at its centre: put your effort into three channels and go deep, instead of spreading it across ten. Marketing methods that need an established brand, a large budget or a sales team belong to a later stage; for the SaaS version of that stage see SaaS marketing.
Before picking channels, write down two things: who exactly the first customers are, and the weekly number you will watch (for example, new activated users, not signups). Everything below is measured against that number.
Why three channels and not ten?
Because with a small budget, spreading thin leaves you with results too noisy to read. A channel test produces a small count of conversions, and small counts swing a lot by chance. If events arrive independently, a count of n has a typical random variation of about the square root of n, which as a share of the count is 1 ÷ √n.
Sample data: a $3,000 monthly test budget, $2.00 per click and a 2% signup rate.
| Plan | Budget per channel | Clicks | Signups | Typical random swing |
|---|---|---|---|---|
| Ten channels | $300 | 150 | 3 | ±58% (1 ÷ √3) |
| Three channels | $1,000 | 500 | 10 | ±32% (1 ÷ √10) |
With 3 signups, a channel could look twice as good or half as good next month with no change at all. With 10 you still cannot read small differences, but you can tell a working channel from a dead one. The same logic applies to channels that cost time instead of money: ten channels at an hour a week each teach you less than three at three hours each.
Depth has a second benefit. Most channels have a learning curve, and the first attempts are usually the worst: weak message, wrong audience, untagged links. Going back to the same channel three times in a row beats trying three different ones once.
Which channels can a startup test, and what does each cost?
The table lists common starting channels and what they cost in the currency that is scarce for a startup: money, time and waiting.
| Channel | Main cost | How soon you learn something | Fits best when |
|---|---|---|---|
| Founder-led outreach (email, messages, calls) | Founder hours | Days | Few, identifiable buyers; a higher-priced product |
| Waitlist or existing-contact email | Writing time | Days | You already have a list, even a small one |
| Communities and forums where buyers ask questions | Time and credibility | Days to weeks | The audience gathers in a few named places |
| Paid search or social ads | Cash | Days, once tracking works | People already search for the problem; margin supports a click cost |
| Content and SEO | Writing time; waiting | Weeks to months | Search demand exists and you can say something specific; see SEO for startups |
| Partnerships and integrations | Relationship time; some development | Weeks to months | Another product's users are your users |
"How soon you learn" is the column to weigh against runway. A channel that pays back after six months is a different bet from one that can tell you yes or no in two weeks.
| Channel | Main cost | How soon you learn |
|---|---|---|
| Founder-led outreach | Founder hours | Days |
| Waitlist or contact email | Writing time | Days |
| Communities and forums | Time and credibility | Days to weeks |
| Paid search or social ads | Cash | Days, once tracking works |
| Content and SEO | Writing time; waiting | Weeks to months |
| Partnerships and integrations | Relationship time; some development | Weeks to months |
Weigh the last column against your runway.
How do you pick your three?
Score each candidate from 1 to 5 on four questions, add the scores, and keep the top three. The questions are: does it reach your buyers, is it cheap to test, will you get an answer quickly, and can your team do it well. Higher is better on every column, so a cheap test scores 5 on cost.
Sample data (your own scores will differ):
| Channel | Reach | Cheap to test | Fast answer | Team skill | Total |
|---|---|---|---|---|---|
| Founder-led outreach | 4 | 4 | 5 | 4 | 17 |
| Waitlist email | 2 | 5 | 5 | 4 | 16 |
| Communities | 3 | 5 | 4 | 3 | 15 |
| Paid search | 4 | 2 | 5 | 3 | 14 |
| Content and SEO | 4 | 3 | 1 | 3 | 11 |
| Partnerships | 3 | 4 | 2 | 2 | 11 |
Outreach, waitlist email and communities win here, with paid search one point behind. Treat a gap of one point as a tie and break it with a factual question: where is your audience already asking for this? A scoring sheet does not remove judgement; it forces the judgement to be written down so you can revisit it in a month.
Keep one slot open for something that is not on the list but that a customer told you about. Customer conversations produce channels that no table does.
How should you split the budget and judge the results?
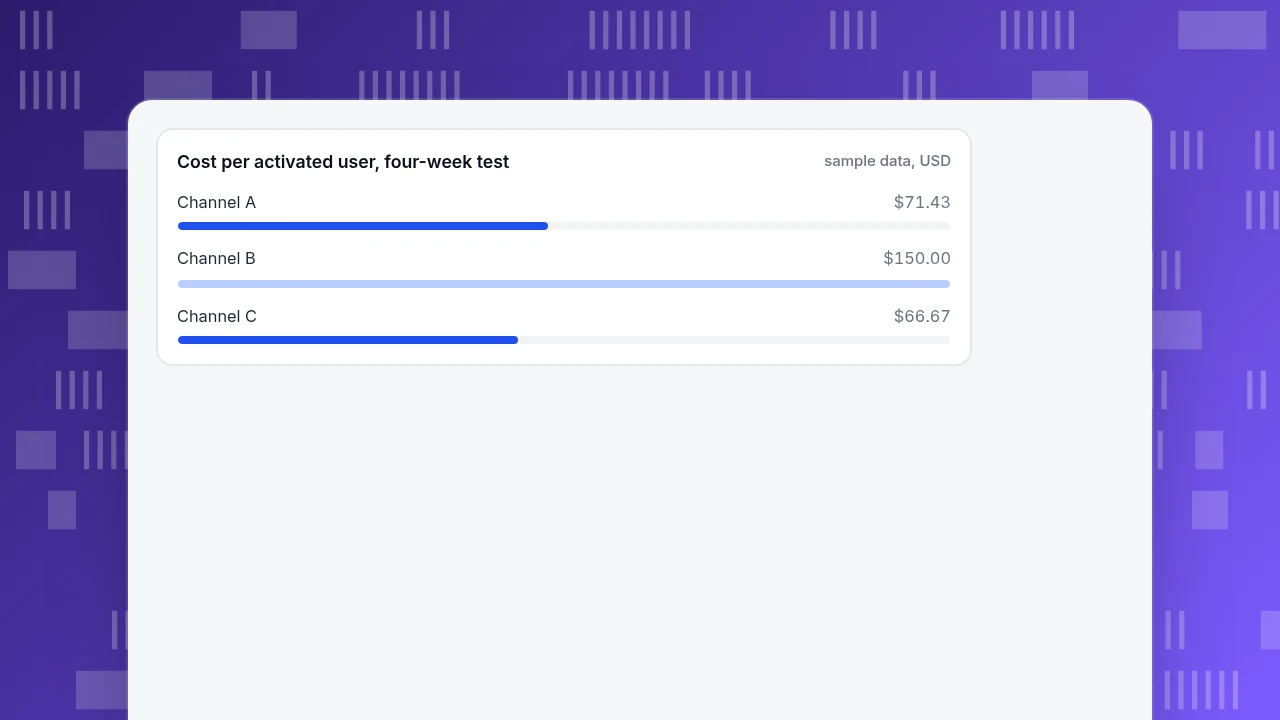
Give each of the three channels a fixed four-week test, tag every link so the traffic can be told apart, and judge each channel by cost per activated user, not cost per signup. An activated user is someone who has done the one thing that predicts they will stay, for example created a first project. Signup cost rewards channels that attract curious people.
Sample data: $3,000 spent over four weeks across three channels.
| Channel | Spend | Signups | Activated | Cost per signup | Cost per activated user |
|---|---|---|---|---|---|
| A | $1,500 | 60 | 21 | $25.00 | $71.43 |
| B | $900 | 45 | 6 | $20.00 | $150.00 |
| C | $600 | 15 | 9 | $40.00 | $66.67 |
| Total | $3,000 | 120 | 36 | $25.00 | $83.33 |
On signup cost, B looks like the best of the three. On activated users it is the worst, at $150.00 against $71.43 and $66.67. C looks expensive by signup and is the cheapest by activation.
Before shifting money, check the sample size. B has only 6 activated users, a typical random swing of about ±41% (1 ÷ √6). A and C have 21 and 9. So the sensible move is not to cancel B but to cut it to a smaller budget, keep tagging, and rerun for four more weeks. A rule of thumb that works: change at most one channel's budget at a time, and only when the gap is larger than the random swing. Ask also whether the channel can absorb more money; a channel with 15 signups may not scale tenfold.
Cost per activated user, four-week test
sample data, USDWhat mistakes waste a startup's first months?
- Counting signups instead of activation. As the example shows, the ranking of channels can reverse.
- Rotating channels every week. Each switch resets the learning curve, and none of the tests reaches a readable count.
- Not tagging links. Without
utm_mediumandutm_source, outreach and community traffic arrive as direct or referral and cannot be compared. The tagging rules are in traffic sources. - Copying a funded competitor's mix. Their budget, brand and sales team are not yours; a channel that works at their scale may be unreadable at yours.
- Tracking vanity numbers. Followers and impressions do not tell you whether people use the product. The numbers that do are in startup metrics.
- Stopping at acquisition. If the people a channel brings do not come back, the channel is not working, however cheap the signups. Read the retention curve before scaling; see retention metrics.
How to measure channel results in TapCub
Here is how the four-week test above looks in TapCub, using the same three channels.
- Tag every link before the test starts. Use
utm_source,utm_mediumandutm_campaignon outreach messages, community posts and ads, with the naming rules in the UTM naming guide. TapCub does not write or send the outreach or run the ads; it measures what comes back. - Read arrivals by channel. Web analytics › Sources shows visitors, sessions, bounce and conversions per channel, and the UTM tab splits them by source, medium and campaign. Real people and recognised bots are counted separately, so cost per visitor is not inflated by automated visits.
- Define activation as a goal. Set up the "activated" action (for example, creating a first project) as a goal in Web analytics › Goals. The Sources table then shows, per channel, how many visitors reached it, which is the denominator you need for cost per activated user.
- Add the spend. In All-platform analytics › Business › Channel ROI, import spend by day, channel and campaign. TapCub computes cost per click as spend ÷ sessions and, where you have orders, cost per acquisition from purchases. For cost per activated user, divide spend by the goal count yourself, as in the table above.
- Mark the dates and check who stays. Add the start of each test in Configuration › Annotations, then open All-platform analytics › Behavior › Behavior analysis, pick retention and run it once per channel with a filter on UTM source or channel, to see whether the cheap channel's users come back. Retention does not split by channel on its own, so the filter is how you compare.
TapCub does not run campaigns, send email, bid on ads or tell you which channels to pick. It reports what each channel brought and what those people did next.
FAQ
What is startup marketing?
Startup marketing is the work of finding the first repeatable ways to reach customers while money, time and brand are all limited. It differs from established-company marketing in its goal: learning which channel works, fast, rather than maximising reach. Its yardstick is usually the weekly count of new activated users, and its method is a few focused experiments.
Which marketing channels should a startup use first?
Start with channels that give a fast answer at low cost and reach your actual buyers: founder-led outreach, email to an existing list and the communities where your buyers ask questions. Add paid ads when you can track activation, and content and SEO when search demand exists and you can wait for the results.
How much should a startup spend on marketing?
There is no universal percentage. A useful rule is to spend enough on each channel to get a readable result. In the sample, $1,000 per channel produced about 10 signups with a random swing of ±32%, while $300 produced 3 with ±58%. If the budget cannot give each channel a readable count, test fewer channels.
How many marketing channels should a startup focus on?
Three at a time is a workable limit for a small team: enough to compare, few enough that each gets a readable result. Run each for a fixed period, tag all links, and replace one channel at a time only when its cost per activated user is clearly worse than the others.
How long should a startup test a marketing channel?
Four weeks is a reasonable first test for channels that give quick feedback, such as outreach, email, communities and paid ads. Slower channels such as content and partnerships need months, so judge them on leading signs like rankings, replies and referrals, and decide in advance when you will review.
Sources
- Paul Graham. Startup = Growth, September 2012. Weekly growth benchmarks: 5-7% good during Y Combinator, 10% exceptional, 1% a warning sign. Checked 2026-11-19.
- Paul Graham. Do Things that Don't Scale, July 2013. Recruiting the first users by hand. Checked 2026-11-19.
- Google. URL builders: Collect campaign data with custom URLs, Analytics Help. Required campaign parameters. Checked 2026-11-19.
Was this article helpful?
We use your answers to fix and expand this page.
Couldn’t send. Please try again in a minute.
Thanks for the feedback. We’ll use it to improve this page.You’ve already sent feedback on this page. Thanks.

Product Experience Specialist
Explores usability, user journeys, and feature adoption through practical examples of onboarding and everyday product use.