Try it on your own data
Every report in this article is in the free plan. One snippet for web and apps, up to 10 sites.
Start freeShoppable content examples include shoppable video, social posts with product tags, galleries with hotspots, articles with product cards and live shopping. To track revenue from each, give every link its own UTM labels, record orders with their value and credit them with more than one attribution model. In the sample, ten orders worth $750 rank the formats differently under first and last touch, and the programme returns 1.60 on revenue but only 0.64 on margin.
What you will learn
- Give every format a handle: UTM source, medium, campaign and content on each link, with the format in a field your reports can group by
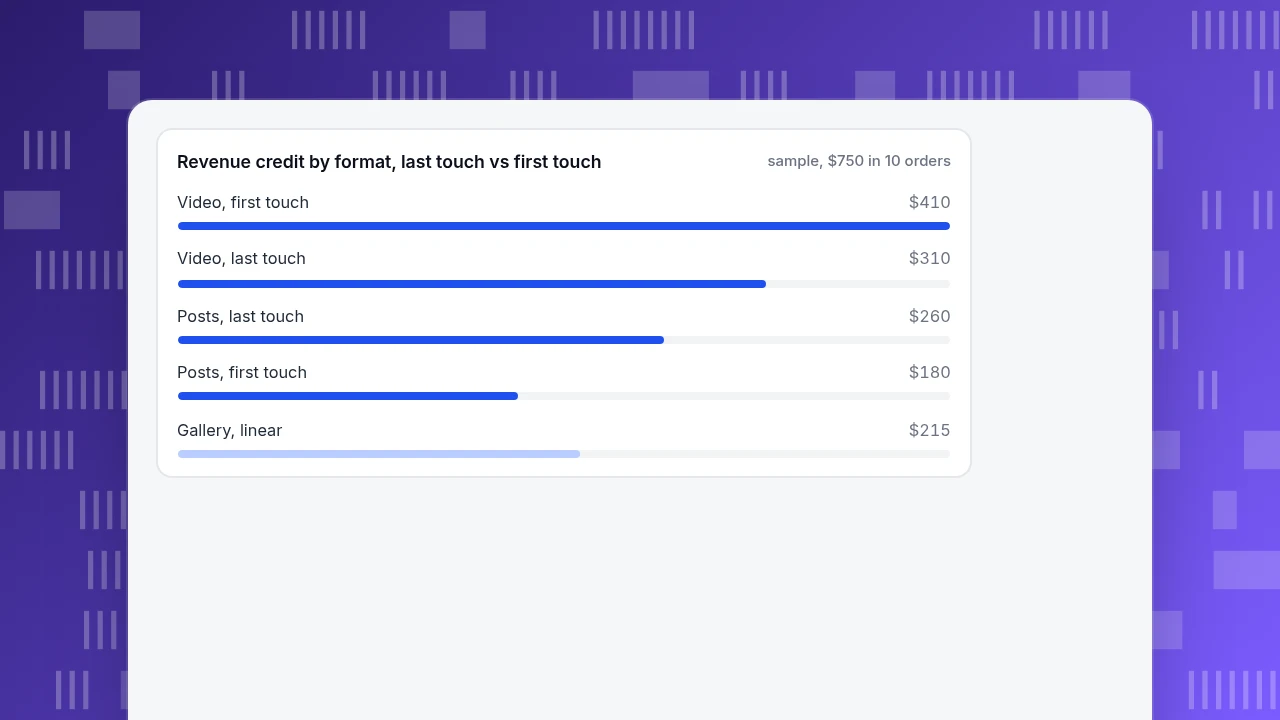
- Compare first and last touch: in the sample, video opens journeys ($410 first vs $310 last) while posts close them ($180 vs $260)
- Judge return on margin, not revenue: at a 40% margin, break-even is 2.5; the sample earned 1.60 on revenue and 0.64 on margin
What are the main kinds of shoppable content, with examples?
Shoppable content is any content where the viewer can go from looking to buying in one or two taps, without searching for the product. The formats differ in what the "click" is, and that decides how you can track it. The table above lists five, and here is what each looks like in practice:
- Shoppable video. A product video where items are tagged at the moment they appear, or a link and product card sit beside the player. Example: a how-to video of a kitchen setup with a "shop this scene" strip underneath listing the six items shown.
- Shoppable social post. A photo or short video with product tags, or a caption link and a link-in-bio page. Example: a styled outfit photo where each garment is tagged to its product page.
- Shoppable gallery or lookbook. An image with hotspots, or a grid where each tile opens a product. Example: a room photo where clicking the sofa, lamp or rug opens that item.
- Shoppable article. An editorial page with inline product cards. Example: "5 gifts under $50" with an add-to-cart button on each pick.
- Live shopping. A scheduled live stream with products pinned while the host demonstrates them.
Notice what is common: each format needs a handle, a label you can attach to every click so the sale can be traced back to a specific piece of content. Without it, you know that people bought, and not whether the video, the post or the gallery caused it.
| Format | Example | What the click is | Tracking handle |
|---|---|---|---|
| Shoppable video | How-to video with a shop-this-scene strip | A tag or card beside the player | Per-video link with UTMs |
| Social post | Outfit photo with tagged items | A product tag or caption link | Per-post UTM link; platform sales report if checkout is in-app |
| Gallery or lookbook | Room photo with hotspots | A hotspot on the image | One link per hotspot with utm_content |
| Shoppable article | Gift guide with add-to-cart cards | A card inside the page | Per-card UTM or event |
| Live shopping | Streamed demo with pinned products | A pinned product link | Per-episode link and code |
If checkout happens inside a platform, your site cannot see the order; use that platform's report and a per-format code.
Why measure shoppable content at all?
Because the content is expensive and the sales it influences are often credited to something else. The U.S. Census Bureau's quarterly report put e-commerce at $347.3 billion in the third quarter of 2026 (seasonally adjusted), 17.9% of total retail sales, released 19 November 2026. That is more than one retail dollar in six spent online, so a good deal of your content already works as a storefront whether or not you call it shoppable.
Measuring answers three questions: which format earns back its cost (return), which format starts the journey and which one finishes it (role), and whether the platform's own numbers agree with what reaches your store (reconciliation). The worked example below answers the first two with numbers.
How do you tag each format so revenue can be traced?
Give every link its own UTM parameters. Google's documentation says to always include utm_source, utm_medium and utm_campaign, notes that utm_content tells apart links in the same piece, and warns that values are case sensitive, so use lowercase. Use one naming table for everything:
| Format | utm_source | utm_medium | utm_campaign | utm_content |
|---|---|---|---|---|
| Shoppable video | youtube or the platform | video | spring_video | kitchen_howto_v1 |
| Social post | the platform | social | spring_post | outfit_12 |
| Gallery or lookbook | site | gallery | spring_gallery | living_room |
| Shoppable article | blog | article | gifts_under_50 | pick_3 |
| Live shopping | the platform | live | spring_live | episode_2 |
Three tagging rules apply whichever tool you use:
- Put the format in a field your reports can group by. In the table, the format sits in
utm_campaign(for examplespring_video) as well asutm_medium, so tools that group by source or campaign can separate formats, not just channels. - Tag every product link in the piece separately when a piece has several (
utm_content=item_1,item_2), so you can see which tagged product earned the click. - Know where checkout happens. If a platform completes the purchase inside its own app, your site never sees the visit or the order. Use that platform's sales report for those sales, and give the format a code or product SKU you can search in your order system.
If the content carries paid or gifted endorsements, disclose the relationship where viewers will see it. The U.S. Federal Trade Commission's guidance for influencers says disclosures should be placed with the endorsement itself and be "hard to miss", not behind a "more" link or buried in a group of hashtags, and that in videos the disclosure should appear in the video and audio, not only in the description. Tracking tells you what sold; the disclosure keeps the sale compliant. See social commerce for how the channel works end to end.
How do you attribute revenue to each format?
Sample data. A store runs three formats for a spring collection, with production and fees of $250 for video, $120 for social posts and $100 for the gallery. Ten orders arrived in the month, each with the ordered list of formats the buyer touched before purchasing:
| Order | Touches in order | Order value |
|---|---|---|
| 1 | video, post | $80 |
| 2 | post | $50 |
| 3 | video | $120 |
| 4 | gallery, video | $90 |
| 5 | post, gallery, video | $60 |
| 6 | video, post, gallery, post | $100 |
| 7 | gallery | $70 |
| 8 | post, video | $40 |
| 9 | video, gallery | $110 |
| 10 | post | $30 |
The total is $750. Credit each order four ways. First touch gives all of it to the first format. Last touch gives it all to the final one. Linear splits it equally. Position-based gives one touch everything, two touches half each, and three or more 40% to the first, 40% to the last and the remaining 20% shared between the middle. For order 5 ($60 over post, gallery, video) that is $24, $12 and $24.
| Format | First touch | Last touch | Linear | Position-based | Spend |
|---|---|---|---|---|---|
| Video | $410 | $310 | $325 | $344 | $250 |
| Social post | $180 | $260 | $210 | $214 | $120 |
| Gallery | $160 | $180 | $215 | $192 | $100 |
| Total | $750 | $750 | $750 | $750 | $470 |
Every model sums to $750, which is the check that the credit is complete. Return on ad spend (credit ÷ spend) then depends on the model:
- Last touch: video 310 ÷ 250 = 1.24, posts 260 ÷ 120 = 2.17, gallery 180 ÷ 100 = 1.80.
- Linear: video 1.30, posts 1.75, gallery 215 ÷ 100 = 2.15.
Two readings, and one warning:
- Roles differ. Video gets $410 under first touch but $310 under last touch: it opens more journeys than it closes. Posts are the opposite ($180 against $260): they close. A last-touch report would call video the weakest format and cut it, even though it brings people in.
- The ranking moves with the model. Posts win under last touch (2.17), the gallery wins under linear (2.15). When the order flips between models, the data cannot tell you which is better yet.
- Revenue is not profit. At a 40% gross margin, break-even return on spend is 1 ÷ 0.4 = 2.5. The whole programme returned 750 ÷ 470 = 1.60 on revenue, and 750 × 0.4 ÷ 470 = 0.64 on margin: on a first-order basis it lost money, even though every format "returned more than it cost" on revenue. Whether that is acceptable depends on repeat purchases and on what the content is worth beyond the sale.
Ten orders is too few to act on. The point of the table is the method: run all models side by side, compare first with last to classify each format as opener or closer, and compute return on margin, not revenue. For the model definitions, see revenue attribution.
Revenue credit by format, last touch vs first touch
sample, $750 in 10 ordersWhat goes wrong when you track shoppable content?
Four faults account for most missing or inflated numbers. Check them before launch, using one test order per format:
- One shared link-in-bio. If every post points to the same URL, all clicks look alike. Give each post its own tagged link, or send people to a page whose links carry
utm_contentper post. - Parameters lost on the way. Redirects, link shorteners and in-app browsers can drop or rewrite the query string. Click your own link from the real app on a phone and confirm the visit arrives with its UTM labels in a real-time report.
- Counting add-to-carts as sales. Report the sale on the order, not the cart event; carts that are never paid inflate every format.
- Different windows. A platform report may credit a sale within its own click or view window, while your store credits within another. Reconcile on one window (30 days is a common choice) before comparing the two.
Run the four checks once per format and keep the test order's ID, so you can find it again when a number looks wrong.
How do you track shoppable content in TapCub?
For the three-format example above, TapCub supplies the measurement; it does not tag products in a post, run the shop or host the video.
- Tag the links with the naming table. Put the format in
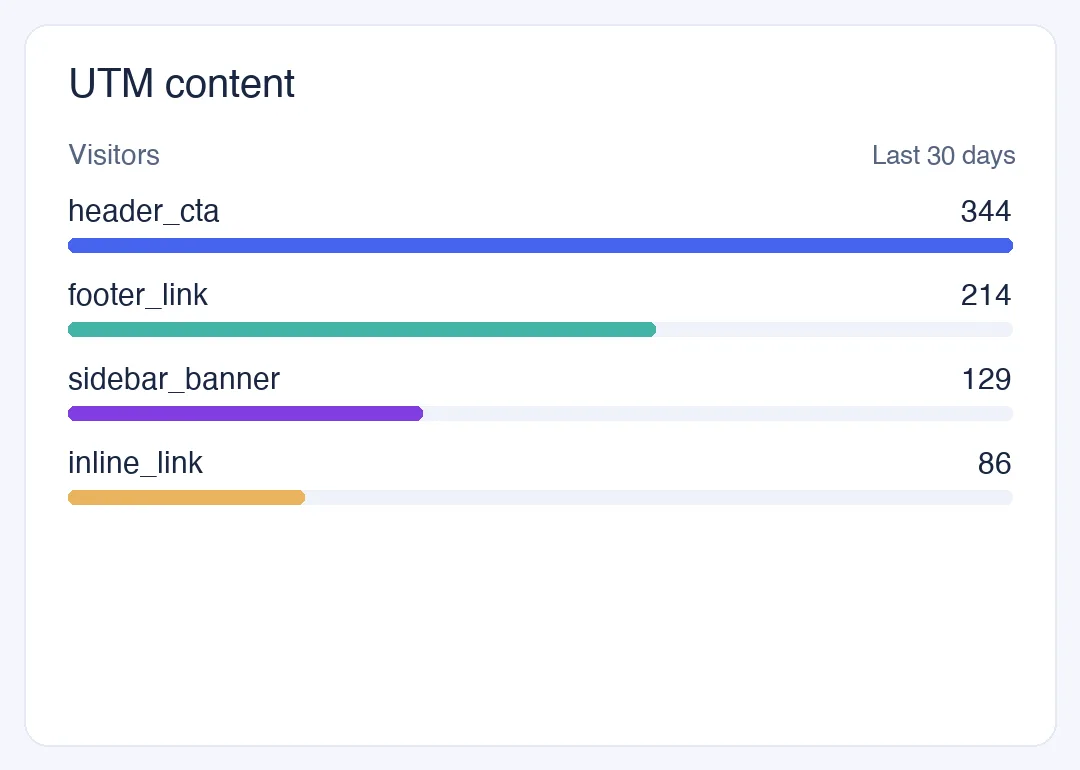
utm_sourceorutm_campaign, because TapCub's attribution touchpoints can be channel, source channel, UTM source, UTM campaign, source domain or landing page, but notutm_content. - Check the traffic. Web analytics › Sources has a UTM tab split into source, medium, campaign, term and content, with visitors, sessions and bounce for each. Click a row to filter other reports to it.
- Send the orders. Send a
purchaseevent from your server withorder_id,revenueandcurrency; revenue in the business reports comes from the order ledger. See All-platform analytics › Business › Commerce & revenue. - Compare models side by side. In All-platform analytics › Behavior › Behavior analysis, open attribution and pick several models at once (first, last, linear, position, time decay). Each model is a column, so an "assist-only" format is visible at once. The look-back window defaults to 30 days and includes the converting session.
- Compare cost with revenue. In All-platform analytics › Business › Channel ROI, import the spend by day, channel, source or campaign (CSV or line by line). The page shows cost per click, cost per acquisition and return on ad spend, grouped by campaign. Margin return is the part you add in a spreadsheet.
A caution: if checkout happens inside a platform, those orders never reach your store, and TapCub cannot attribute them.
FAQ
What is shoppable content?
Content that lets a viewer go from looking to buying in a tap or two: tagged products in video or photos, product cards in articles, hotspots on images, or pinned items in a live stream.
What are examples of shoppable content?
Shoppable video with a "shop this scene" strip, social posts with product tags, image galleries with hotspots, editorial pages with inline add-to-cart cards, and live streams with pinned products.
How do you measure the ROI of shoppable content?
Tag every link with UTM parameters, record orders with their value, import what the content cost, and divide credited revenue by spend. Use margin, not revenue, for the final return, and compare several attribution models before cutting a format.
Which attribution model is best for shoppable content?
No single model is. First touch shows which formats open journeys, last touch shows which close them, and linear or position-based spreads credit. Compare them side by side; in the sample the ranking changed between models.
Do shoppable posts need an ad disclosure?
If there is a material connection such as payment or free product, yes. The FTC says the disclosure should be placed with the endorsement and be hard to miss, not hidden behind a "more" link.
Sources
- U.S. Census Bureau, Quarterly Retail E-Commerce Sales: $347.3 billion and 17.9% of retail in Q3 2026, released 19 November 2026 (page checked 2026-11-20).
- Google Analytics Help, Collect campaign data with custom URLs: UTM parameters and case sensitivity.
- FTC, Disclosures 101 for Social Media Influencers: placement and wording of disclosures.
Was this article helpful?
We use your answers to fix and expand this page.
Couldn’t send. Please try again in a minute.
Thanks for the feedback. We’ll use it to improve this page.You’ve already sent feedback on this page. Thanks.

Product Analyst
Focuses on event analysis, conversion funnels, and retention, using clear metric definitions and structured analysis to explain product performance.