Try it on your own data
Every report in this article is in the free plan. One snippet for web and apps, up to 10 sites.
Start freeServer-side testing is an experiment where your backend chooses the variant and sends the finished page, API response or email, while client-side testing changes the page in the browser after it loads. The difference is where the choice is made, and it decides flicker, added latency and what you can test. This guide compares the two, prices delay (an extra 150 ms is $3,600 a month on a $400,000 store at Bing's sensitivity) and shows how to check a split for sample ratio mismatch.
What you will learn
- The only real difference is where the variant is chosen; flicker, latency, test scope and who builds it all follow from that
- Put a number on delay: at 0.6% revenue per 100 ms, +150 ms on a $400,000 month is $3,600; set a latency budget before the test
- Check the split first: 10,300 vs 9,700 in a 50/50 test is chi-square 18 and a mismatch, while 10,050 vs 9,950 is noise
What is server-side testing, and how is it different from client-side testing?
Server-side testing is an A/B test (or multivariate test) where your application's backend decides which variant a user gets and builds the response accordingly. In client-side testing, the page loads first and a script in the browser then changes it. The only real difference is where the variant is chosen, and everything else in the comparison table above follows from it: how visible the change is while loading, how much time it adds, what you can test and who has to build it.
A server-side test works like this:
- A request arrives. Your code looks up or computes the user's bucket from a stable ID (a user ID, or a long-lived anonymous ID).
- The code renders variant A or B, or runs variant logic such as a different price, ranking, discount rule or email.
- The code records an exposure: this user saw variant B, at this time.
- Later events (a purchase, a signup) are matched to the exposure to compute the difference.
Closely related is a feature flag, which is the switch that turns a variant on for some users. Most server-side tests use one under the hood. A flag decides who sees what; an experiment adds the measurement and the statistics on top.
Server-side testing is a different thing from server-side tracking, which moves where measurement events are sent from. You can run client-side tests with server-side tracking, or the reverse.
| Aspect | Client-side testing | Server-side testing |
|---|---|---|
| Where the variant is chosen | In the browser, after the page loads | In your backend, before the response |
| Flicker | Possible; hiding the page trades it for delay | None from the test itself |
| Latency | Script request and execution | Bucket lookup; a remote flag call adds a round trip |
| What you can test | Copy, layout, images, colours | Pricing, ranking, checkout logic, apps, emails, APIs |
| Who builds it | Marketers with a visual tool | Engineers with a release |
| Consistency across devices | By browser cookie | By user ID |
| Setup time | Short | Longer |
Neither is better in every case; match the tool to what changes.
Why does client-side testing flicker, and how bad is it?
A client-side tool loads, finds the elements to change and swaps them after the browser has already started painting. If the page shows the original headline for a moment and then replaces it, visitors see a flash of the wrong content. The usual patch is to hide the page until the script finishes, which swaps the flicker for a blank delay.
Flicker is also a layout problem. Google's Core Web Vitals measure unexpected movement as Cumulative Layout Shift (CLS). A shift's score is impact fraction × distance fraction: the share of the viewport covered by the moving content across two frames, times the largest distance moved as a share of the viewport. Pages are rated good at 0.1 or less, needs improvement up to 0.25, and poor above that, at the 75th percentile of loads. Web.dev's guidance is direct about the cause: content injected after load, especially near the top, causes larger shifts, and the fix is to reserve space or avoid inserting it at all.
An example, as sample data: a test replaces a promo banner that takes up 60% of the viewport area (across both frames) and shifts the content below it by 20% of the viewport height. The shift is 0.6 × 0.2 = 0.12, which is in the "needs improvement" band by itself, before any other shifts on the page are added.
Server-side testing sidesteps this because the HTML that arrives is already the chosen variant. There is no swap. That does not make it free of layout problems (a slow personalised block can still pop in), but the test itself adds no shift.
What does the extra latency cost?
Time is the other half of the trade, and it is easy to see in one direction and miss in the other:
- Client-side adds a script request, execution time, and, if you hide the page to prevent flicker, a delay before anything shows.
- Server-side adds the time to look up the bucket and to build the variant. With rules held in your own process this is tiny; with a call to a separate flag service it adds a network round trip to every request. Measure it rather than assume.
How much does delay matter? The best-known controlled evidence comes from Kohavi and colleagues at Microsoft (KDD 2014), who slowed a share of Bing users on purpose. They found a 250 ms server delay cut revenue by about 1.5% and click-through by 0.25%, and the results implied about 0.6% of revenue per 100 ms. That is one site's sensitivity, not a law, but it gives a way to put a number on your own added time:
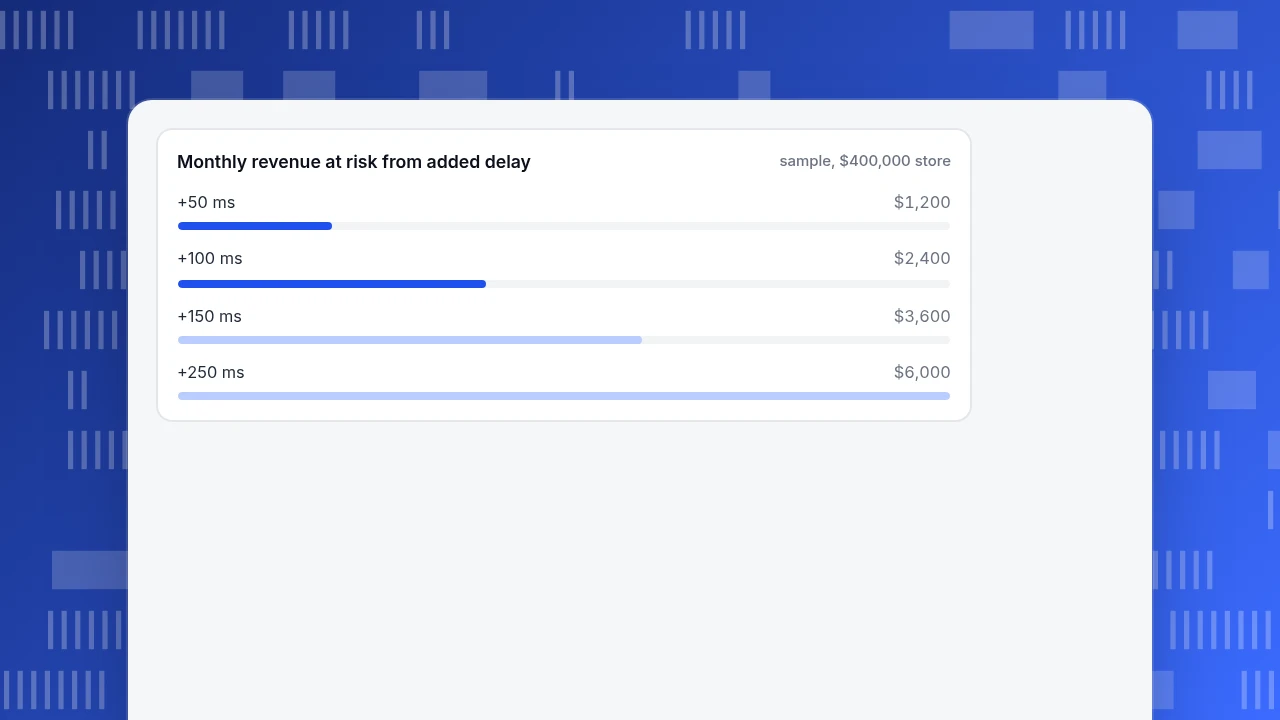
Sample data. A store has $400,000 of monthly revenue. Assume its sensitivity matches that 0.6% per 100 ms. An extra 150 ms is 150 ÷ 100 × 0.6% = 0.9%, or $3,600 a month. At 250 ms the same arithmetic gives 1.5%, or $6,000. The chart shows the range. Use it as a ceiling for a worry, not a forecast: your own sensitivity could be lower or higher, and the way to find it is a controlled slowdown on your own traffic.
The practical rule: set a latency budget before the test (for example, no more than 50 ms added at the 75th percentile) and watch it as a guardrail while the test runs, so a "winning" variant that is slower does not hide its cost.
Monthly revenue at risk from added delay
sample, $400,000 storeWhen do you need server-side testing instead of client-side?
Match the tool to what changes:
| What you want to test | Better fit | Why |
|---|---|---|
| Headline, button copy, image, colour, section order | Client-side | Marketers can change it without a release |
| Price, discount rule, shipping threshold, checkout logic | Server-side | The logic lives in the backend; consistency matters |
| Search ranking, recommendations, sorting | Server-side | The decision happens before HTML exists |
| A mobile app screen or API response | Server-side | There is no page for a browser script to edit |
| Emails or notifications | Server-side | The variant is built by your sending system |
| Anything that must stay the same across devices and sessions | Server-side | Bucketing by user ID, not by browser cookie |
| A quick layout idea with no engineering time | Client-side | Fastest way to a first answer |
Two other constraints push toward the server: a test that touches security or payments should not rely on a browser script, and a test that must work for visitors who block scripts cannot depend on one. Against it: server-side tests need engineering time and a release process, so they are slower to launch and harder to hand to a marketing team.
How do you keep a server-side test trustworthy?
Four checks, in the order you should run them:
- Bucket by a stable ID. Use the user ID once someone is logged in, and a long-lived visitor ID before that, so a person sees the same variant every time. Re-randomising on each session mixes the groups.
- Log the exposure at the decision, not the page view. Record the variant at the moment your code chooses it, with a timestamp and the same ID that later events carry. A test that only counts people who reached a later page analyses a different population in each arm.
- Check the split before the result. If you planned 50/50, the group sizes should be close to equal. A significant difference is called a sample ratio mismatch (SRM), and a chi-square test detects it. Fabijan and colleagues, drawing on experiments at four software companies and over 25 products, describe it as a symptom of data-quality problems; a result from an experiment with an SRM should not be trusted until the cause is found.
- Keep bots out. Automated requests get bucketed too, and they rarely convert, which dilutes both arms and can skew them differently. Filter known bots from exposure and outcome counts.
Here is the SRM check in numbers, as sample data. Of 20,000 users planned for a 50/50 test, 10,300 are in A and 9,700 in B. Expected in each arm: 10,000. Chi-square = (10,300 − 10,000)² ÷ 10,000 + (9,700 − 10,000)² ÷ 10,000 = 9 + 9 = 18. With one degree of freedom, p ≈ 0.00002, so unlikely under a fair 50/50 split (about 1 in 45,000) that you stop and investigate (a flag evaluated differently on one platform, a crash in one variant, a cache serving one version). Now take 10,050 and 9,950: chi-square = 0.25 + 0.25 = 0.5, p ≈ 0.48. That is ordinary noise, and you can proceed to the outcome.
How do you measure a server-side test in TapCub?
TapCub does not split traffic, serve variants or run feature flags. Your application does that; TapCub measures what happened afterwards. For the sample test above, here is how to set it up.
- Send an exposure event from your server for each user. Use different event names per variant, such as
exposure_aandexposure_b, through the server events interface (POST /api/v1/track) with the samelogin_idand, where you have it, the visit'ssession_idso the event attaches to the right visit. Create the key under Configuration › Settings › API keys with the Server track scope. - Build one funnel per variant. In All-platform analytics › Behavior › Behavior analysis, create a funnel whose first step is
exposure_aand whose last step ispurchase; build a second one starting atexposure_b. The first-step counts are your split, so you can run the SRM check from them. The conversion rates are the outcome. - Track revenue and a goal. Under Web analytics › Goals, define the goal and turn on revenue tracking with the revenue property name, so the total is next to the conversion rate.
- Watch guardrails. In Monitoring › Performance, compare real-user Core Web Vitals before and after a client-side test goes live. In All-platform analytics › Operations › Monitors, set a monitor on
error_rateorbounce_rate; a trial run shows how many times it would have fired over the past 30 days. Add a date annotation under Configuration › Annotations for each release so charts show the change. - Read the result with the interval in mind. TapCub gives you the counts and rates. The significance test and sample-size planning stay in your experimentation tool or a spreadsheet.
FAQ
What is server-side testing in simple terms?
It is an experiment in which your backend picks the variant and sends the user the finished version, so nothing is swapped in the browser. The logic can be as small as a different price or as big as a different search ranking.
Is server-side testing better than client-side testing?
Neither is better in all cases. Client-side suits quick visual and copy changes with no engineering. Server-side suits logic, pricing, ranking, apps and emails, and avoids flicker, at the cost of engineering time.
Does server-side testing remove flicker?
The test itself adds none, because the HTML arrives as the chosen variant. Other parts of the page can still shift, so check Cumulative Layout Shift: good is 0.1 or less at the 75th percentile.
What is a sample ratio mismatch?
A significant gap between the group sizes you planned and those you got, such as 10,300 against 9,700 in a 50/50 test. A chi-square test detects it; treat it as a data-quality alarm and find the cause before reading the result.
Does server-side testing need feature flags?
Not strictly, but most teams use one to control who gets each variant. A flag decides exposure; the experiment adds measurement. See the feature flag glossary page for the difference.
Sources
- Kohavi et al., Seven Rules of Thumb for Web Site Experimenters, KDD 2014: slowdown experiments at Bing; 250 ms about 1.5% of revenue (figures read from a summary of the paper, checked 2026-11-20).
- web.dev, Cumulative Layout Shift: thresholds of 0.1 and 0.25, the 75th percentile and the score formula.
- web.dev, Optimize Cumulative Layout Shift: injected content and reserving space.
- Fabijan et al., Diagnosing Sample Ratio Mismatch in Online Controlled Experiments, KDD 2019: SRM as a symptom of data-quality issues; four companies, more than 25 products.
Was this article helpful?
We use your answers to fix and expand this page.
Couldn’t send. Please try again in a minute.
Thanks for the feedback. We’ll use it to improve this page.You’ve already sent feedback on this page. Thanks.

Data Analyst
Explores traffic sources, conversion funnels, and retention, using clear metric definitions and concrete examples to explain what the numbers mean.