Try it on your own data
Every report in this article is in the free plan. One snippet for web and apps, up to 10 sites.
Start freeRevenue attribution assigns the value of each order to the marketing touches that came before it, using a rule such as first touch or linear, so credited revenue across channels always adds up to total revenue. Compare several models: the gap between a channel's first-touch and last-touch credit shows whether it starts or closes sales.
What you will learn
- Every model must distribute the full order value: in the sample all five columns sum to $270
- Social earns $90 under first touch and $0 under last touch; Direct earns $0 and $120. Same orders, different roles
- A 14-day lookback instead of 30 moves first-touch credit for order 1 from Search to Email; decide budget from the range, not one model
What is revenue attribution, and how is it different from conversion attribution?
Revenue attribution splits the money from each order across the marketing touches that came before it. Conversion attribution splits the count: one order, one credit. Revenue attribution splits the amount, so a $120 order moves a channel's number four times as far as a $30 order does.
Two properties make it easy to check. Every model you choose must distribute the whole order value, so credited revenue always adds up to total revenue. And the models differ only in who gets which share. The table sets out the five rules in common use.
Which models you can use depends on the tool. Google's Analytics help states that the first click, linear, time decay and position-based models are no longer available as of November 2023, and Google Ads says the same for those models in its own reporting. If your tool offers only last click or a data-driven model, you can still reproduce the other four in a spreadsheet with the method below.
| Model | Rule | Favours |
|---|---|---|
| First touch | All credit to the earliest touch | Channels that start journeys |
| Last touch | All credit to the latest touch | Channels that close |
| Linear | Equal share to every touch | Channels that assist |
| Position | 1 touch: all; 2 touches: half each; more: 40% first and last, 20% shared by the middle | Opening and closing touches |
| Time decay | Weight proportional to 0.5^(days ÷ half-life) | Touches close to the order |
Weights for one order always add up to 1; credit is order value × weight.
How do five models credit the same three orders?
Sample data: three orders, with the channels each buyer touched and how many days before the order each touch happened.
| Order | Value | Touches (days before order) |
|---|---|---|
| 1 | $120 | Search (20) → Email (9) → Direct (0) |
| 2 | $90 | Social (12) → Search (1) |
| 3 | $60 | Email (0) |
Total revenue is $270. Credit by model, recomputed in Python:
| Channel | First touch | Last touch | Linear | Position (40/20/40) | Time decay (7-day half-life) |
|---|---|---|---|---|---|
| Search | $120.00 | $90.00 | $85.00 | $93.00 | $78.04 |
| $60.00 | $60.00 | $100.00 | $84.00 | $91.79 | |
| Direct | $0.00 | $120.00 | $40.00 | $48.00 | $77.51 |
| Social | $90.00 | $0.00 | $45.00 | $45.00 | $22.66 |
| Total | $270.00 | $270.00 | $270.00 | $270.00 | $270.00 |
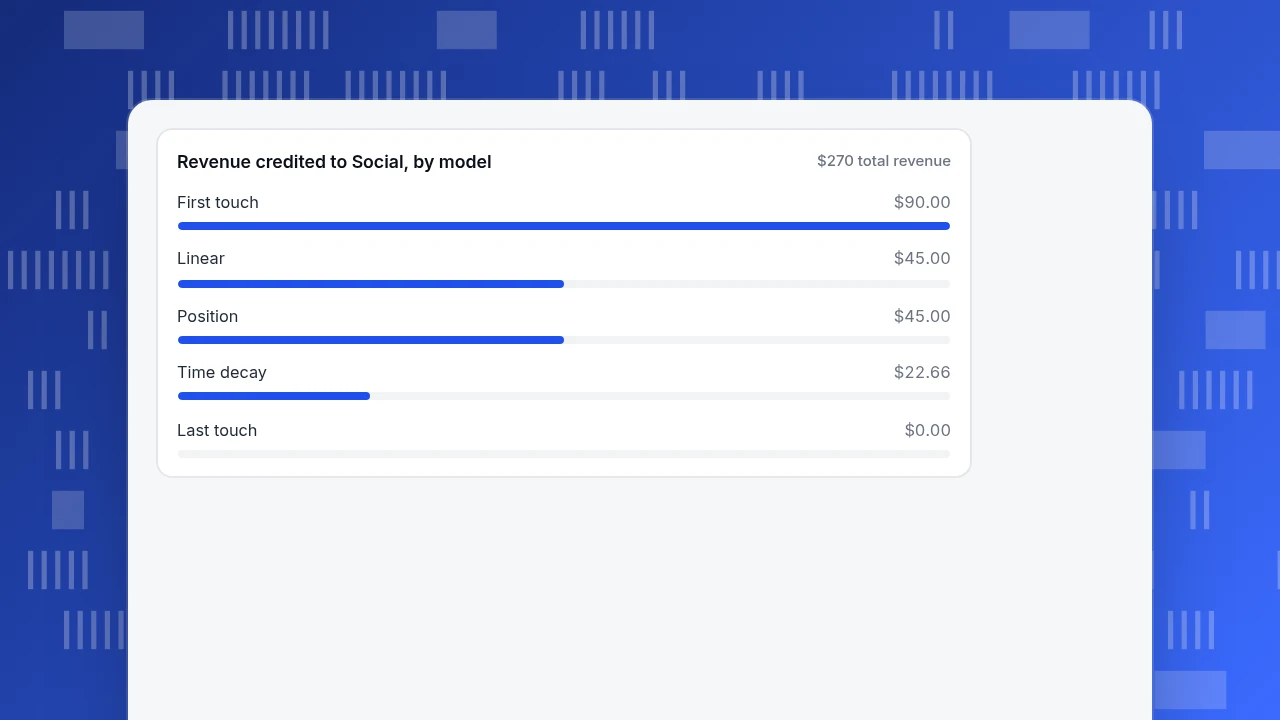
Every column sums to $270, which is the check to run on your own report. Now read across the rows: Social earns $90 under first touch and nothing under last touch. Direct earns $120 under last touch and nothing under first. Both are true descriptions of the same three orders.
What do the differences tell you?
The gap between a channel's first-touch and last-touch credit is a role, not an error:
- Introducer: first-touch credit is higher than last-touch. In the sample, Social ($90 vs $0) and Search ($120 vs $90).
- Closer: last-touch credit is higher than first-touch. Direct ($120 vs $0).
- Both: equal credit in both columns, as for Email ($60 and $60): it was the only touch in order 3 and a middle touch in order 1.
If you only look at last touch, Social looks worthless, and cutting it would remove the channel that started a $90 order. If you only look at first touch, Direct looks worthless, though it was the visit that finished a $120 order. A big Direct figure under last touch is also a prompt to ask whether those visits were really untagged versions of earlier channels, for example a link opened from an app that strips the referrer.
Revenue credited to Social, by model
$270 total revenueHow are the models calculated?
Each model gives a weight to each touch, and the weights for an order add up to 1. Credit is order value times weight.
- First touch: weight 1 to the earliest touch.
- Last touch: weight 1 to the latest touch.
- Linear: 1 ÷ number of touches each. Order 1 has three touches, so $40 each.
- Position: one touch gets everything; two touches get half each; with more, the first and last get 40% each and the middle touches share the remaining 20%. Order 1: Search 40%, Email 20%, Direct 40%, so $48, $24, $48.
- Time decay: weight proportional to 0.5^(days ÷ half-life). With a 7-day half-life, order 1's raw weights are 0.138 (20 days), 0.410 (9 days) and 1.000 (0 days), which total 1.548. Normalised they are 8.9%, 26.5% and 64.6%, so Search gets $10.70, Email $31.79 and Direct $77.51.
Pick the model by the question. Use first touch to ask what starts journeys, last touch for what finishes them, and linear, position or time decay when you want credit shared and need to see assisting channels at all.
How far back should the lookback window go?
The lookback window decides which touches are eligible. Google Analytics documents defaults of 30 days for acquisition key events and 90 days for all other key events, with 7 days as an alternative for acquisition and 30 or 60 days for others. A window that is too short throws away early touches, which pushes credit toward the closing channels.
Shrink the window in the sample to 14 days. Order 1's Search touch (20 days before) falls out. First touch now gives $180 to Email and $0 to Search, instead of $60 and $120. Last touch does not change, and linear changes because order 1 has two touches instead of three. The same data gives a different answer to "how much did Search produce?" depending only on the window.
Rule of thumb: set the window to roughly your median time from first visit to order. If most buyers order within a week, 30 days is generous; if your buying cycle is six weeks, a 30-day window will under-credit the channels that start it.
How do you use the result for budget?
Do not move budget on a single model. Instead, compute a range. Sample data: over the same period, Search cost $30, Social $40 and Email $5. Revenue credited per dollar of spend:
| Channel | First touch | Last touch | Linear |
|---|---|---|---|
| Search | 4.00 | 3.00 | 2.83 |
| Social | 2.25 | 0.00 | 1.13 |
| 12.00 | 12.00 | 20.00 |
Social's return runs from 0.00 to 2.25 depending on the model; Email stays high on all three. The decision rules:
- A channel that is worthwhile under every model is safe to keep or grow.
- A channel with zero under last touch and a positive number under first or linear is an introducer. Do not cut it on last-touch alone; test a reduction on a small share of spend and watch total orders.
- A channel that is poor under every model is the candidate to cut.
Attribution says who was present before an order, not who caused it. Only a controlled test, such as holding out a region or a time window, shows what would have happened without a channel.
What commonly goes wrong?
- Using order value, not margin. A $120 order at 35% margin is $42 of margin. Credit margin if you decide budget by profit.
- Ignoring refunds. If 8% of the $270 is refunded, credit $248.40, not $270. Do this as a separate adjustment so the models still reconcile.
- Mixing currencies or tax. Credit net revenue in one currency.
- Counting one order twice. An order that is imported and also tracked by script appears twice; deduplicate by order ID.
- Comparing models of different windows. Always change one setting at a time.
- Ignoring cross-device journeys. A buyer who browses on a phone and orders on a laptop looks like two people, so the early touch is lost. Identify logged-in users so both devices join one person.
- Treating Direct as a channel to invest in. It is a bucket of visits with no recorded source.
How do you do this in TapCub?
TapCub's attribution report credits conversions using the sessions before the conversion, not an install postback. It credits conversion counts, not dollars, so revenue needs one extra step. Here is how the three-order example maps.
- Choose the goal. Under All-platform analytics › Behavior › Behavior analysis, pick the attribution analysis and set the goal to your order event or thank-you page. It is required.
- Set the touch and window. The touch defaults to channel (an empty channel falls back to the referrer channel); you can also choose referrer channel, UTM source, UTM campaign, referrer domain or landing page. The lookback window defaults to 30 days (1 to 90) and includes the session of the conversion.
- Select all models. Choose first touch, last touch, linear, position and time decay (half-life 7 days by default, 1 to 90). Each model is a column, so introducers and closers show up side by side, as in the table above.
- Read the numbers. You get conversions, attributed conversions, conversions with no touch, and average touches per attributed conversion. Each row shows paths, touch sessions and a touch rate (paths divided by touch sessions). Rows are ordered by last-touch credit and capped at 200.
- Turn credit into money. Take each channel's credit share from step 4, and check revenue in All-platform analytics › Business › Goals. If order values vary a lot, as in the sample ($60 to $120), apply the same model to dollars in a spreadsheet. For return on spend, import costs in All-platform analytics › Business › Channel ROI, which shows cost per click, cost per acquisition and return on ad spend by channel, source or campaign.
- Know the limits. At most 50,000 conversions are scored. TapCub does not run holdout tests or ad bidding, and does not do install attribution: it only receives postbacks from your attribution provider.
FAQ
What is revenue attribution?
Revenue attribution assigns the value of each order to the marketing touches that came before it, using a rule such as first touch or linear. Credited revenue across channels adds up to total revenue.
How is revenue attribution calculated?
For each order, give every touch a weight that sums to 1, multiply by the order value, then add up by channel. In the sample, a $120 order with three touches under linear credits $40 to each.
What is the difference between revenue and conversion attribution?
Conversion attribution splits the count of orders or leads; revenue attribution splits their value. A channel that closes a few big orders ranks higher on revenue than on count.
Which attribution model should I use?
Use first touch to see what starts journeys, last touch to see what closes them, and linear, position or time decay to share credit. Compare at least three and look for channels whose rank changes.
How long should the attribution window be?
About your median time from first visit to order. Google Analytics defaults are 30 days for acquisition key events and 90 days for the others. Too short a window removes early touches.
See also: Shoppable Content Examples and How to Track Revenue From Each.
Sources
- Google Analytics Help, Attribution modeling and lookback windows: lookback windows (30 / 90 days defaults); first click, linear, time decay and position-based models no longer available as of November 2023. Checked 2026-11-20.
- Google Ads Help, About attribution models: last click and data-driven remain; first click, linear, time decay and position-based no longer supported. Checked 2026-11-20.
Was this article helpful?
We use your answers to fix and expand this page.
Couldn’t send. Please try again in a minute.
Thanks for the feedback. We’ll use it to improve this page.You’ve already sent feedback on this page. Thanks.

Data Analyst
Explores traffic sources, conversion funnels, and retention, using clear metric definitions and concrete examples to explain what the numbers mean.