Try it on your own data
Every report in this article is in the free plan. One snippet for web and apps, up to 10 sites.
Start freeSaaS benchmarks from public reports put the median private company at about 22–26% annual growth, 101–102% net revenue retention (NRR), 88–90% gross revenue retention (GRR) and a CAC payback near 12 months as a rule of thumb. But each report slices companies differently, so compare yourself on contract size and ARR band, not against one blended number.
What you will learn
- Public reports slice by ARR band, contract value or funding, so no single report gives a clean stage-by-stage table
- Median private SaaS growth is about 22–26%, NRR about 101–102% and GRR about 88%; top-decile growth figures describe funded outliers
- Judge NRR and CAC payback together and compare with companies at your contract size, not the whole population
Which public SaaS benchmark reports are worth using?
Four recent public sources cover growth, retention and acquisition cost for private B2B companies. They survey different companies and slice the data on different axes, so you cannot read one stage-by-stage table off any single report. That is the first thing to know before you compare yourself to anyone.
| Source | Sample and period | Slices by | What it gives you |
|---|---|---|---|
| ChartMogul SaaS Growth Report | More than 2,200 SaaS businesses, 12 months ending June 2023 | ARR band | Growth rates, share of new ARR from expansion |
| Benchmarkit 2025 B2B SaaS Performance Metrics | Private B2B companies, 2024 data | ARR band and contract value (ACV) | Growth, NRR, GRR, CAC ratios, expansion share |
| SaaS Capital retention and growth briefs | Private B2B companies above $1M ARR, 2024–2025 data | ACV, funding type | NRR quartiles, median growth |
| High Alpha and Growth Unhinged SaaS Benchmarks 2025 | More than 800 companies surveyed in August–September 2025 | ARR band | Growth, NRR, efficiency quadrants |
Two cautions apply to all four. They are voluntary surveys or customer-data samples, so companies that fill them in are not a random draw. And ChartMogul says its own milestone data carries survivorship bias, since only 13% of SaaS startups reach $10M ARR even after 10 years in business. Treat every figure below as a reference range, not a target. If you still need the metric definitions first, start with SaaS metrics.
What are typical SaaS growth rates by ARR stage?
Growth falls steeply as ARR rises, and the gap between the median company and the top decile is large. ChartMogul reports the top decile growing 192% a year at $1–3M ARR, 121% at $3–8M and 110% at $8–15M, while the top quartile grows around 60–70% and the median business around 30%.
More recent medians are lower. Benchmarkit's 2024 data puts the median growth rate at 26% and the top quartile at 50%, down from 60% in 2023. SaaS Capital, which surveys companies above $1M ARR, reports a median of 22% for 2025 (25% the year before). Bootstrapped companies sit at 20% and equity-backed ones at 25%. Only 7.3% of its sample reported flat or negative growth.
| ARR stage | What public reports say about growth |
|---|---|
| Under $1M | Highest spread. High Alpha's top quartile reached 300% year on year in 2025 |
| $1–3M | ChartMogul top decile 192% |
| $3–8M | ChartMogul top decile 121% |
| $8–15M | ChartMogul top decile 110% |
| All private companies above $1M | Median 22% (SaaS Capital, 2025), 26% (Benchmarkit, 2024), top quartile 50% (Benchmarkit) |
The practical reading: the top-decile numbers describe the companies investors fund, not the typical outcome. For a healthy but ordinary business, the useful comparison is the median and the top quartile for your size.
What do NRR and GRR benchmarks look like?
Net revenue retention (NRR) is the revenue today from customers you had twelve months ago, divided by what they paid then, including upgrades. Gross revenue retention (GRR) is the same calculation without upgrades, so it cannot exceed 100%. SaaS Capital defines NRR as December MRR from customers who were customers the previous December, divided by that earlier total MRR; GRR is the same excluding upsells.
- Benchmarkit 2024 data: median NRR 101%. GRR slipped over three years from 90% to 88%, so about 12% of starting revenue is lost each year to cancellations and downgrades.
- SaaS Capital 2025: for companies with contract values of $25,000–50,000, median NRR is 102%, with a top quartile of 111% and a bottom quartile of 97%. Higher contract value goes with higher NRR.
- Growth link: SaaS Capital finds growth rises with NRR. Moving from the 90–100% NRR range to 100–110% adds about 5 percentage points of growth, and the highest-NRR group grows 173% faster than the population median.
- Expansion matters more with scale: Benchmarkit finds expansion ARR makes up 40% of all new ARR at the median, 58% for companies at $50–100M. ChartMogul sees the share of new ARR from expansion rising from 29.1% in 2020 to 36.3% for companies at $5–30M.
The takeaway for churn: an annual GRR near 88–90% is where the median private company sits, and a median NRR near 101–102% means expansion roughly offsets the losses, nothing more. If your GRR is below that, fix churn before spending on acquisition; what a good retention rate is covers that decision in more detail.
| Metric | Formula | Sample company | Reported median |
|---|---|---|---|
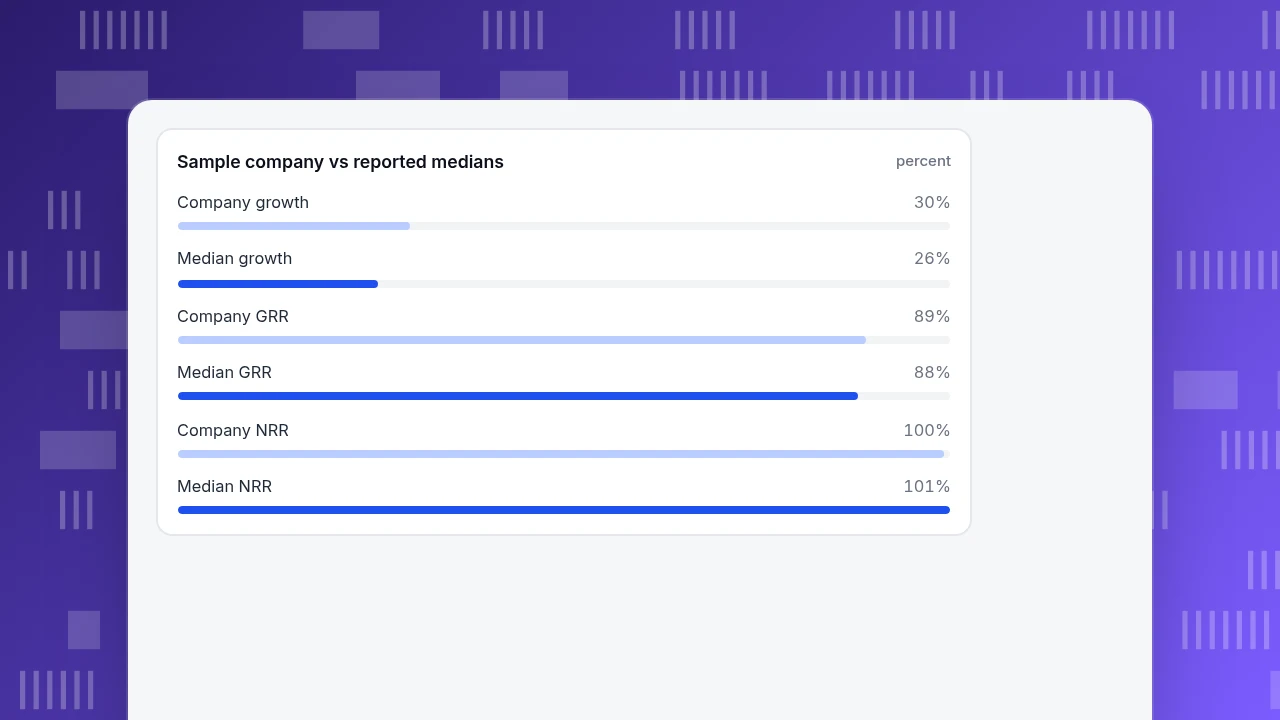
| Annual growth | Ending ARR ÷ starting ARR − 1 | 30% | 26% (Benchmarkit) / 22% (SaaS Capital) |
| GRR | (Start − churn − downgrades) ÷ start | 89% | 88% (Benchmarkit) |
| NRR | (Start − churn − downgrades + expansion) ÷ start | 100% | 101% (Benchmarkit) |
| New CAC ratio | Sales and marketing ÷ new-customer ARR | $2.00 | $2.00 (Benchmarkit) |
| CAC payback | Sales and marketing ÷ (new ARR × gross margin) × 12 | 32 months | About 12 months rule of thumb |
Sample data: starting ARR $3.00M, S&M $1.80M, gross margin 75%. Medians are from the cited reports and each uses its own sample.
How long should CAC payback take?
CAC payback is the number of months of gross profit from a new customer needed to repay what you spent to win them. Benchmarkit notes that around 12 months is the common rule of thumb, but says the figure depends heavily on contract value, and that median payback has risen 12.5% since 2022. Its New CAC ratio, total sales and marketing spend divided by new-customer ARR, had a median of $2.00 in 2024 (up 14%), and the weakest quartile spent $2.82 for each $1.00 of new customer ARR.
Two details change how to read these numbers. First, contracts of $10,000–50,000 are often more expensive to acquire than $50,000–100,000 contracts, so a mid-priced product should not compare itself to the whole population. Second, the new-customer ratio and the blended ratio, which also credits expansion ARR, differ by a lot. Benchmarkit's blended ratio fell $0.19 in 2024 mainly because expansion made up more of new ARR.
The High Alpha and Growth Unhinged analysis, drawn from about 5,000 companies over nine years, adds a useful pairing: the two best predictors of long-term profitable growth are CAC payback and NRR, so look at them together.
| Group (2025 survey) | Share of respondents | Average growth | Rule of 40 |
|---|---|---|---|
| High NRR and low CAC payback | 13% | 71% | 47% |
| High NRR and high CAC payback | 15% | 40% | 21% |
| Low NRR and low CAC payback | 15% | 30% | 33% |
| Low NRR and high CAC payback | 12% | 10% | 5% |
Worked example: where does a $3M ARR company sit?
Sample data, recomputed in Python. A company starts the year at $3.00M ARR. During the year it loses $0.27M to cancellations and $0.06M to downgrades, gains $0.33M from expansion and $0.90M from new customers. Sales and marketing spend is $1.80M, gross margin is 75%.
- Ending ARR = 3.00 − 0.27 − 0.06 + 0.33 + 0.90 = $3.90M, so growth is 3.90 ÷ 3.00 − 1 = 30%.
- GRR = (3.00 − 0.27 − 0.06) ÷ 3.00 = 89%.
- NRR = (3.00 − 0.27 − 0.06 + 0.33) ÷ 3.00 = 100%.
- New CAC ratio = 1.80 ÷ 0.90 = $2.00. Blended CAC ratio = 1.80 ÷ (0.90 + 0.33) = $1.46.
- CAC payback on new customers = 1.80 ÷ (0.90 × 0.75) × 12 = 32 months; on new plus expansion ARR = 1.80 ÷ (1.23 × 0.75) × 12 = 23.4 months.
Compared with the reports: growth of 30% is above the 22–26% medians; GRR of 89% and NRR of 100% sit at the median; the new CAC ratio of $2.00 equals Benchmarkit's median. The weak spot is payback, 32 months against a rule of thumb of about 12, and Benchmarkit warns that this rule shifts with contract value, so the company should compare against peers at its own contract size. The leverage point is clear too: growth here is almost entirely new-customer ARR. With NRR at 100%, the base adds nothing. If NRR rose to 110% and new ARR stayed at $0.90M, growth would be 40%, the same result as raising new ARR from $0.90M to $1.20M, and the two paths need different investments.
Sample company vs reported medians
percentHow do you choose the right comparison slice?
Use this order, and stop at the first slice that has data.
- Contract value first for retention and CAC. SaaS Capital and Benchmarkit both show NRR, GRR and payback moving with ACV. A $20 a month product and a $250,000 a year product are not peers.
- ARR band for growth. Growth falls with size, so compare to your band's median, not the whole population.
- Pair metrics. Judge NRR and CAC payback together, as in the quadrant table. A high CAC payback with high NRR is a viable enterprise profile; with low NRR it is the weakest group.
- Check the survey date and sample. Reports built on 2023 data and 2025 data differ by several points in median growth; label which year you compare to.
- Use quartiles, not just medians. SaaS Capital's 97%, 102% and 111% NRR for one contract band show that the middle half of companies spans 14 points.
Where does product usage data fit in?
TapCub does not do billing or revenue accounting, so it cannot calculate ARR, NRR, GRR or CAC payback; those come from your billing system and finance sheet. What it measures is usage, which tends to move before revenue does. Using the example above, a team that wants to know why GRR is 89% could do this:
- In All-platform analytics › Behavior › Behavior analysis, build a retention view for customers who signed up in the same period, and see how many are still active in later periods. Compare it with your billing churn by cohort.
- If you sell to companies, send the account with
tapcub.groupafter login, then open All-platform analytics › Users › Accounts. It shows active accounts over the last 30 days and a 0–100 health score built from member activity, so you can list accounts whose usage is falling before renewal. - Send your paid-conversion event so that Web analytics › Goals and Web analytics › Sources show which channels bring customers who stay, to inform the CAC half. The spend side lives in All-platform analytics › Business › Channel ROI, where you can import spend by day, channel and campaign.
- Keep the benchmark comparison in your own sheet. TapCub does not store industry benchmarks and does not calculate revenue retention.
FAQ
What is a good SaaS growth rate?
It depends on size. Recent medians for private companies are 22–26% a year, with top quartiles near 50%. Smaller companies grow faster: ChartMogul's top decile was 192% at $1–3M ARR and 110% at $8–15M ARR. Compare with companies in your ARR band, not the whole market.
What is a good net revenue retention rate?
Medians cluster around 101–102%. For $25,000–50,000 contracts SaaS Capital reports a median of 102%, a top quartile of 111% and a bottom quartile of 97%. A company above 110% is in the top group for its contract size, and one below 100% is shrinking from its existing base.
What is a good CAC payback period?
About 12 months is the common rule of thumb, but Benchmarkit shows payback depends on contract value and has risen 12.5% since 2022. Calculate it on a gross-margin basis, say whether you include expansion ARR, and compare with companies selling at a similar price.
How is annual churn related to GRR?
Annual gross revenue churn is 100% minus GRR. Benchmarkit's median GRR of 88% means roughly 12% of starting revenue is lost each year through cancellations and downgrades. In the worked example, GRR of 89% corresponds to $0.33M, or 11%, of lost ARR.
Can I trust SaaS benchmark reports?
Use them as ranges. Most are voluntary surveys or samples from one vendor's customers, and ChartMogul notes its milestone data has survivorship bias. Check the sample size, the year, and the slice before copying a number into a board deck.
Sources
- Benchmarkit. 2025 B2B SaaS Performance Metrics Benchmarks (2024 data: growth, NRR, GRR, CAC ratios, expansion share). Checked 2026-11-20.
- SaaS Capital. 2025 SaaS Retention Benchmarks for Private B2B Companies (NRR and GRR definitions, NRR by contract value, published September 2025). Checked 2026-11-20.
- SaaS Capital. Private B2B SaaS Company Growth Rate Benchmarks (median growth 22%, NRR and growth link). Checked 2026-11-20.
- ChartMogul. SaaS Growth Report (growth by ARR band, expansion share, survivorship note). Checked 2026-11-20.
- Kyle Poyar, Growth Unhinged. The 2025 SaaS Benchmarks report (800+ companies, NRR and CAC payback quadrants). Checked 2026-11-20.
Was this article helpful?
We use your answers to fix and expand this page.
Couldn’t send. Please try again in a minute.
Thanks for the feedback. We’ll use it to improve this page.You’ve already sent feedback on this page. Thanks.

Product Experience Specialist
Explores usability, user journeys, and feature adoption through practical examples of onboarding and everyday product use.