Try it on your own data
Every report in this article is in the free plan. One snippet for web and apps, up to 10 sites.
Start freeA retail analytics dashboard is ten metrics arranged in three bands, result, cause and after the sale, so each row explains the one above it: net sales, orders, average order value and margin; then sessions, conversion, revenue per session and cart abandonment; then returns, repeat purchases and sell-through. In the sample week, $69,120 of gross sales becomes $58,752 net, and a bad following week is traced to conversion, not traffic.
What you will learn
- Arrange tiles from result to cause to follow-through, and write the formula under each tile
- Break any change in sales into sessions × conversion × order value to see where to look first
- Benchmark against your own last four weeks, and use published figures only where the definition matches
What should a retail analytics dashboard answer?
A retail analytics dashboard should answer one question every Monday: did we make or lose money last week, and in which step? That means a small number of metrics arranged so that each row explains the one above it. A dashboard of 40 tiles answers nothing; ten metrics with formulas and a diagnosis path answer most weekly questions. This page gives the layout, the ten metrics and their formulas, a worked week, and the rules for reading it. For wider examples of ecommerce views, see ecommerce dashboard; for a sales-team view, see sales dashboard.
One scope note first. The US Census Bureau's quarterly report puts e-commerce at 17.2% of total retail sales in the third quarter of 2026 (not seasonally adjusted, $335.7 billion), released 19 November 2026. Most retail sales still happen in physical stores, so a retailer with stores needs a store view that this page's online metrics do not replace. The layout below works for the online channel, and the formulas carry over to stores if you can supply the inputs.
What is the dashboard layout?
Arrange three bands, top to bottom, so a reader scans from result to cause to follow-through.
| Band | Question | Tiles (left to right) |
|---|---|---|
| 1. Result | Did we earn it? | Net sales, Orders, Average order value, Gross margin |
| 2. Cause | Which step moved? | Sessions, Conversion rate, Revenue per session, Cart abandonment rate |
| 3. After the sale | Did it stay sold, and will they return? | Return rate, Repeat purchase rate, Sell-through rate |
Rules for the wireframe: put each metric's change against the same weekday last week next to its value; keep the date range identical across tiles; and give every tile a link to the analysis behind it, so a red number leads to a chart, not a meeting.
| Band | Question | Tiles |
|---|---|---|
| 1. Result | Did we earn it? | Net sales, orders, average order value, gross margin |
| 2. Cause | Which step moved? | Sessions, conversion rate, revenue per session, cart abandonment rate |
| 3. After the sale | Did it stay sold, and will they return? | Return rate, repeat purchase rate, sell-through rate |
Put the change against the same weekday last week beside each value, and link each tile to the analysis behind it.
What are the ten metrics and their formulas?
Use these definitions and write them under each tile, because "conversion rate" means different things in different tools.
| # | Metric | Formula | Sample week |
|---|---|---|---|
| 1 | Net sales | Gross sales − returns and refunds | $58,752 |
| 2 | Orders | Count of completed orders | 1,152 |
| 3 | Average order value | Gross sales ÷ orders | $60.00 |
| 4 | Gross margin | (Net sales − cost of goods sold) ÷ net sales | 46.9% |
| 5 | Sessions | Count of visits | 48,000 |
| 6 | Conversion rate | Orders ÷ sessions | 2.40% |
| 7 | Revenue per session | Net sales ÷ sessions | $1.22 |
| 8 | Cart abandonment rate | Sessions with add-to-cart and no purchase ÷ sessions with add-to-cart | 80.0% |
| 9 | Return rate | Returned value ÷ gross sales | 15.0% |
| 10 | Repeat purchase rate | Customers with two or more purchases ÷ customers who purchased | 23.0% |
Sell-through rate (units sold ÷ units received in the period; 3,400 ÷ 5,000 = 68% in the sample) sits beside return rate as the eleventh tile if you carry stock, but it needs inventory data, so it is optional for pure online sellers.
Recompute the sample: 1,152 orders × $60.00 = $69,120 gross; returns at 15% = $10,368; net sales = 69,120 − 10,368 = $58,752. Conversion = 1,152 ÷ 48,000 = 2.40%. Revenue per session = 58,752 ÷ 48,000 = $1.224. Cart sessions of 5,760 (12% of sessions) with 1,152 purchases give 1,152 ÷ 5,760 = 20% completion and 80.0% abandonment. Gross margin with $31,200 of cost of goods: (58,752 − 31,200) ÷ 58,752 = 46.9%. Repeat rate: 230 ÷ 1,000 = 23.0%.
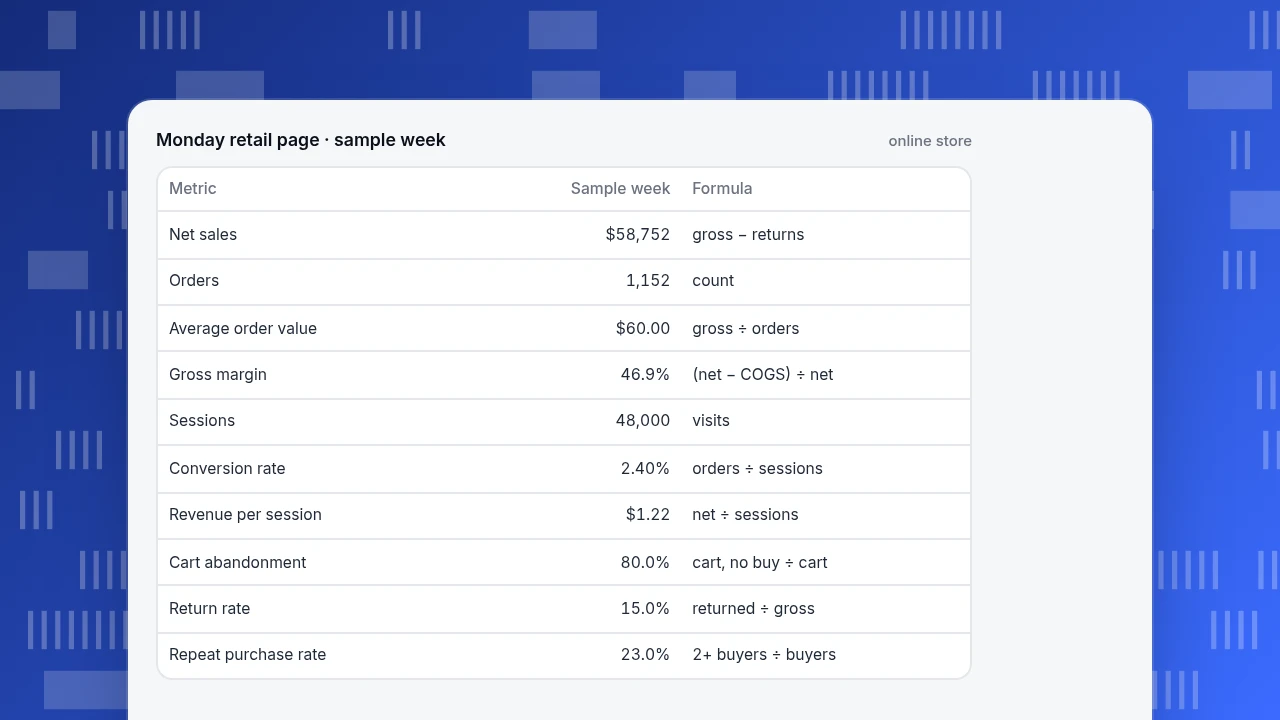
Monday retail page · sample week
online store| Metric | Sample week | Formula |
|---|---|---|
| Net sales | $58,752 | gross − returns |
| Orders | 1,152 | count |
| Average order value | $60.00 | gross ÷ orders |
| Gross margin | 46.9% | (net − COGS) ÷ net |
| Sessions | 48,000 | visits |
| Conversion rate | 2.40% | orders ÷ sessions |
| Revenue per session | $1.22 | net ÷ sessions |
| Cart abandonment | 80.0% | cart, no buy ÷ cart |
| Return rate | 15.0% | returned ÷ gross |
| Repeat purchase rate | 23.0% | 2+ buyers ÷ buyers |
What benchmarks should you compare with?
Compare each metric with your own history first, then with published figures, using only figures whose definition you can match.
- Cart abandonment. The Baymard Institute's compilation of 50 studies gives an average documented abandonment rate of 70.22%. In the sample, 80% is above that average, but abandonment definitions differ between studies and tools; if you measure sessions with an add-to-cart that end without a purchase, expect a different number.
- Returns. The National Retail Federation and Happy Returns reported that retailers estimated 16.9% of 2024 annual sales would be returned, a projected $890 billion (press release of 5 December 2024). The sample's 15.0% is in the same range; your category (apparel returns more than most) matters more than the average.
For the rest (conversion rate, repeat rate, margin) there is no honest universal benchmark, because they depend on category, price point and traffic mix. Use the same weekday in the last four weeks as the benchmark.
How do you read a bad week?
Read down the bands. Net sales is conversion arithmetic: sessions × conversion rate × average order value. Break a change into those three parts and you know where to look.
Sample data: last week (above) versus this week.
| Last week | This week | Effect on gross sales | |
|---|---|---|---|
| Sessions | 48,000 | 45,600 | −$3,456 |
| Conversion rate | 2.40% | 2.20% | −$5,472 |
| Average order value | $60.00 | $61.00 | +$1,003 |
| Gross sales | $69,120 | $61,195 | −$7,925 (−11.5%) |
Recompute: 48,000 × 0.024 × 60 = $69,120 and 45,600 × 0.022 × 61 = $61,195.20. Sessions effect: (45,600 − 48,000) × 0.024 × 60 = −$3,456. Conversion effect at the new sessions: 45,600 × (0.022 − 0.024) × 60 = −$5,472. Order value effect at the new sessions and conversion: 45,600 × 0.022 × (61 − 60) = +$1,003.20. The three add up to −$7,924.80.
Decision rules from the table:
- If conversion is the biggest negative, as here, open the purchase funnel and the cart abandonment tile first; something changed between add-to-cart and payment.
- If sessions are the biggest negative, open the source breakdown: a channel stopped sending traffic.
- If order value is the biggest negative, check discounting and the item mix.
- If net sales fall but gross sales are flat, the cause is in the return rate.
Order matters: fix the largest negative first, and check the others only if they exceed normal weekly variation (use the last four weeks' range).
Which alerts are worth setting?
Alert on the result and cause tiles, not on every number. A useful minimum: conversion rate and orders compared with the same weekday over the last four weeks, and an alert on payment-step errors. An alert that fires every day is ignored by the second week, so test any threshold against the last 30 days before enabling it: it should fire a handful of times, not every morning.
Which metrics belong on the monthly page instead?
Slow-moving stock and cohort metrics do not need a Monday tile; read them monthly. Two are worth defining now.
Weeks of cover = units on hand ÷ average weekly units sold. Sample data: 2,400 units on hand and 600 units sold a week give 2,400 ÷ 600 = 4.0 weeks. If resupply takes 3 weeks and you want 1 week of safety stock, reorder when cover falls to 4.0 weeks or less; at 600 a week that is 2,400 units. Below that line, you will stock out before the delivery arrives.
Repeat purchase rate by first-order month shows whether newer customers return as often as older ones. Sample data: January buyers 1,000 with 230 repeating within 90 days (23.0%); February buyers 1,100 with 220 repeating (20.0%). The 3-point drop is the signal to check what changed in acquisition or the first order, and it is invisible in a weekly total.
How do you build this in TapCub?
TapCub reads orders, refunds and browsing events, so bands 1 and 2 and part of band 3 can be built from one source. Take the sample week and set it up like this.
- Send the events. Install the E-commerce & retail industry pack from All-platform analytics › Business › Industry packs, which writes event definitions, metrics, funnels and dashboards in one step; you still send the events. Required events are
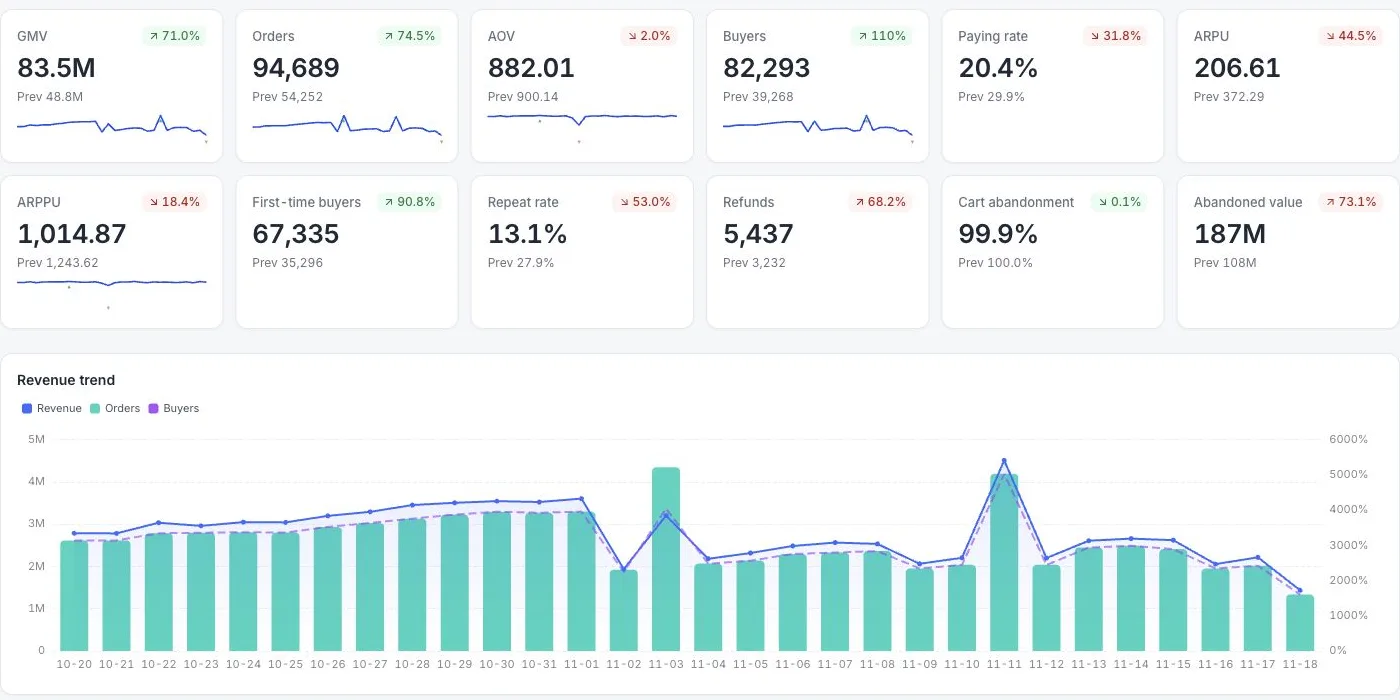
view_item,add_to_cart,begin_checkoutandpurchase; sendpurchaseandrefundfrom the server with an order ID, amount and currency, using the order ID to dedupe retries. - Read the money tiles. All-platform analytics › Business › Commerce & revenue shows revenue, orders, buyers and average order, paying rate, revenue per user and per buyer, first buyers and repeat rate (people with at least two purchases divided by buyers), and refund count and amount. Revenue is gross: refunds in the same period are reported separately and are not subtracted, so net sales is revenue minus refunds, which you compute. Amounts convert to the site base currency, which is CNY unless you change it.
- Read the cause tiles. The same page shows cart abandon rate (sessions with an add-to-cart and no purchase) and the value left behind, and a per-session purchase funnel: view item, add to cart, checkout, purchase. Item, category and brand ranks come from the line items you send in an
itemsarray. - See where the sessions went. Web analytics › Sources splits traffic by channel and UTM, which answers the "sessions fell" branch of the diagnosis.
- Know the limits. TapCub has no stock, cost or margin data, so gross margin and sell-through stay in your inventory or accounting system. It does not measure store footfall. Refunds are not the same as returns; the report counts refund rows, so define return rate from your own returns record if the two differ.
FAQ
What is a retail analytics dashboard?
It is a single view of the metrics that show whether a retailer earned money last week and where it moved: sales, orders, order value, margin, conversion, cart abandonment, returns, repeat purchases and stock sell-through, arranged so each row explains the one above it.
Which metrics should a retail dashboard include?
Ten cover most weekly questions: net sales, orders, average order value, gross margin, sessions, conversion rate, revenue per session, cart abandonment rate, return rate and repeat purchase rate. Add sell-through rate if you hold stock.
How do you calculate conversion rate for retail?
Orders divided by sessions: 1,152 ÷ 48,000 = 2.40% in the sample week. Write the denominator under the tile, since some tools divide by unique visitors instead of sessions, which changes the number.
What is a good return rate for retail?
The National Retail Federation and Happy Returns reported that retailers estimated 16.9% of 2024 annual sales would be returned. Your category matters more than the average, so compare with your own last four weeks first.
How often should you review a retail dashboard?
Weekly for the result and cause tiles, with the same weekday of the last four weeks as the comparison, and monthly for repeat purchase rate and margin, which move slowly.
Sources
- US Census Bureau. Quarterly Retail E-Commerce Sales — Q3 2026: 17.2% of total retail sales (not seasonally adjusted), released 19 November 2026. Verified 2026-11-20.
- National Retail Federation and Happy Returns. 2024 retail returns total $890 billion — 16.9% of annual sales, 5 December 2024. Verified 2026-11-20.
- Baymard Institute. Cart abandonment rate statistics — 70.22% average across 50 studies. Verified 2026-11-20.
Was this article helpful?
We use your answers to fix and expand this page.
Couldn’t send. Please try again in a minute.
Thanks for the feedback. We’ll use it to improve this page.You’ve already sent feedback on this page. Thanks.

Product Experience Specialist
Writes about product experience, practical workflows, and growth, turning complex processes into clear steps for everyday decisions.