Try it on your own data
Every report in this article is in the free plan. One snippet for web and apps, up to 10 sites.
Start freeAn ecommerce dashboard is one screen of store numbers laid out in the order a shopper moves: traffic, conversion, order value, repeat purchase. Put the outcome (revenue) on top and its factors beneath it, with a comparison on every number, and a drop in revenue can be traced down the screen to the row that moved. Eight to ten numbers are enough.
What you will learn
- Order the board like the funnel: traffic, conversion, order value, repeat
- Revenue = sessions × conversion rate × average order value, so a revenue drop always sits in one of the rows beneath it
- Give repeat purchase a fixed window and cohorts; one blended rate hides a decline
What is an ecommerce dashboard?
An ecommerce dashboard is one screen of store numbers arranged in the order a shopper moves: they arrive (traffic), they buy or leave (conversion), they spend something (order value) and, some of them, they come back (repeat). Each row answers one question, and the rows read top to bottom like the customer's path. That ordering is the whole idea. It means that when revenue moves, you can walk down the screen and find the row that moved with it.
A dashboard like this is different from a long list of store metrics. The list is in ecommerce KPIs, which explains the revenue equation and what each KPI means; the analysis side is in ecommerce analytics. This guide is about what to put on the board, in what order, and how to read it.
What goes on an ecommerce dashboard, in what order?
Four rows, plus a small strip for problems. The table gives the metrics, their formulas and the question each one answers.
Three layout rules follow from the table:
- Outcome on top, causes beneath. Revenue (or revenue per session) sits in the top-left. Everything under it is a factor of revenue: revenue = sessions × conversion rate × average order value.
- One comparison per number. Show the previous period, or the same weekday last week, beside every number. A number alone cannot be good or bad.
- One chart per row. A trend line for traffic, a funnel for conversion, a distribution for order value, a cohort table for repeat. More than that makes a row a report.
Keep the board to about eight to ten numbers in total. If you want a fuller list of store numbers, keep it on a second page and link to it.
| Row | Metric | Formula | Question it answers |
|---|---|---|---|
| 1 Traffic | Sessions (real visitors) | Sessions with bots excluded | Are people arriving? |
| 2 Conversion | Conversion rate | Orders ÷ sessions | Does the site turn visits into orders? |
| 2 Conversion | Add-to-cart rate | Add-to-cart sessions ÷ product-view sessions | Is the product page working? |
| 2 Conversion | Checkout completion | Purchases ÷ checkouts started | Is payment working? |
| 3 Order value | Average order value | Revenue ÷ orders | Is each order worth more or less? |
| 3 Order value | Revenue per session | Revenue ÷ sessions | What is one visit worth? |
| 4 Repeat | Repeat rate | Buyers with 2+ purchases ÷ buyers, in a fixed window | Are customers coming back? |
| Strip | Refund rate | Refunded orders ÷ orders | Is revenue holding after sale? |
Put revenue top-left; every row beneath is a factor of it.
Worked example: reading one week from the top down
Sample data: a store compares this week with last week. Traffic is flat at 20,000 sessions both weeks, so the question is which row explains a revenue drop.
| Metric | Last week | This week | Change |
|---|---|---|---|
| Sessions | 20,000 | 20,000 | 0.0% |
| Orders | 750 | 700 | −6.7% (−50 ÷ 750) |
| Conversion rate (orders ÷ sessions) | 3.75% | 3.50% | −0.25 points |
| Average order value | $64 | $64 | 0.0% |
| Revenue | $48,000 | $44,800 | −6.7% (−3,200 ÷ 48,000) |
| Revenue per session | $2.40 | $2.24 | −6.7% |
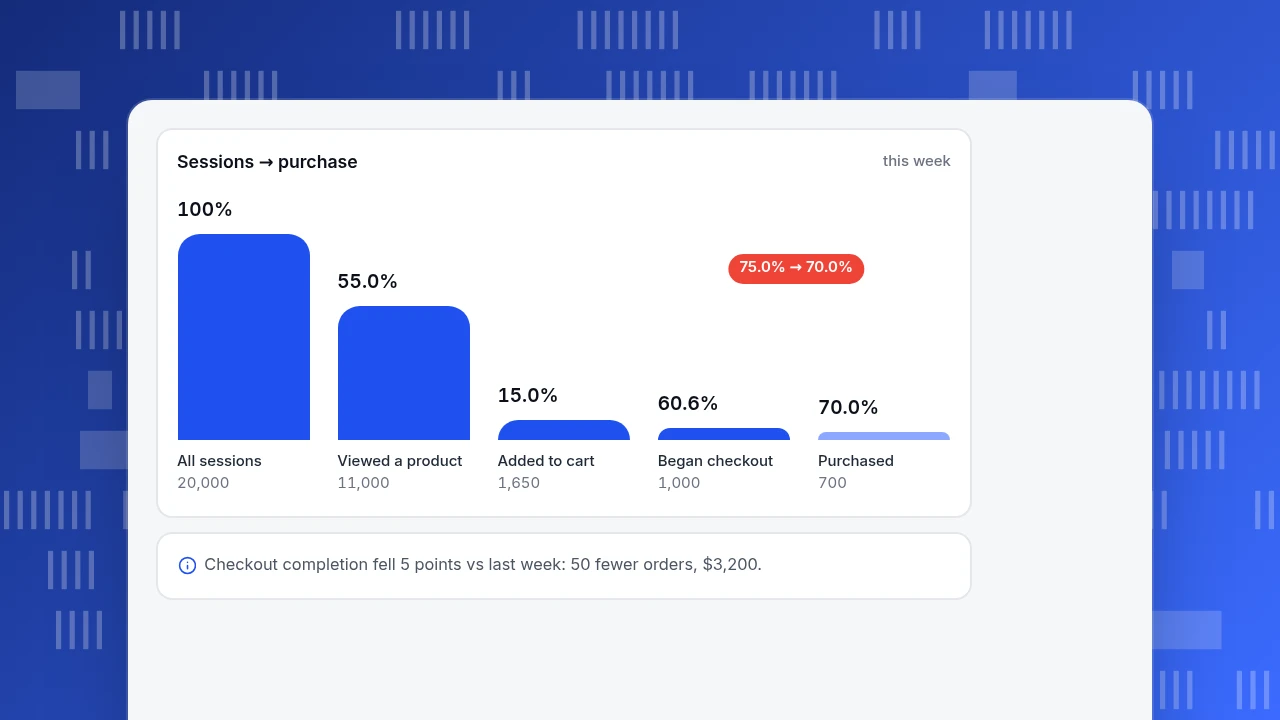
Read top down: traffic did not move, order value did not move, conversion fell. So the cause is somewhere in the funnel. This week's funnel:
| Step | Sessions | Rate from previous step |
|---|---|---|
| All sessions | 20,000 | |
| Viewed a product | 11,000 | 55.0% |
| Added to cart | 1,650 | 15.0% |
| Began checkout | 1,000 | 60.6% |
| Purchased | 700 | 70.0% |
Last week the same funnel had the same numbers down to the checkout step (1,000 checkouts started) and ended with 750 purchases, a 75.0% completion rate. The only step that moved is checkout to purchase: 75.0% → 70.0%.
The size of the problem is easy to compute: 1,000 × (75.0% − 70.0%) = 50 orders, and 50 × $64 = $3,200, which is exactly the revenue drop ($48,000 − $44,800). Nothing else needs explaining. The abandonment tile tells the same story: sessions with an add-to-cart that did not buy were (1,650 − 700) ÷ 1,650 = 57.6%, against (1,650 − 750) ÷ 1,650 = 54.5% last week. The next move is to look at what changed at payment: a payment option, a shipping fee shown late, an error. Which of those it is the dashboard cannot say; it can only tell you where to look.
For a deeper walk through each funnel step, see ecommerce funnel.
Sessions → purchase
this weekAll sessions
20,000
Viewed a product
11,000
Added to cart
1,650
Began checkout
1,000
Purchased
700
How should the dashboard be laid out on the screen?
Different readers need different depths. Build one board with three views rather than three separate boards.
| View | Look at | Numbers | Time frame |
|---|---|---|---|
| Daily glance | Is the store working today? | Orders so far, sessions, conversion rate, checkout errors | Today vs the same weekday last week |
| Weekly review | Why did the week move? | All four rows | This week vs last week |
| Monthly review | Are customers coming back? | Repeat rate, cohorts, customer tiers, refund rate | Month vs previous month |
Practical rules for placement:
- Top row: three to four numbers at most. Revenue, orders, conversion rate and average order value. These are the numbers that answer "how are we doing".
- Second row: the funnel, drawn as steps with the rate between each step. The step with the largest relative loss is not always the one that moved; compare to last week, as the example does.
- Third row: order value and products. Average order value, a few top products, refunds.
- Bottom row: repeat and customers. Slow numbers that change monthly, so they do not need to be on the daily glance.
- Traffic quality belongs next to traffic. Real visitors, not bots, in the sessions number. If crawlers inflate sessions, conversion rate looks lower than it is and the whole top-to-bottom reading breaks.
What does the repeat row need that the others do not?
Traffic, conversion and order value can be read within a week. Repeat purchase cannot, because it needs a window long enough for a second order to happen. Use a fixed window (90 days is common for stores with frequent purchases; longer for rare purchases) and state it on the tile.
Repeat rate = buyers with at least two purchases in the window ÷ all buyers in the window.
Sample data: in the 90 days to the end of the month, 1,800 people bought and 360 of them bought at least twice: 360 ÷ 1,800 = 20.0%.
A single number hides the trend, so show monthly first-purchase cohorts beside it:
| First-purchase month | Buyers | Bought again within 90 days | Repeat rate |
|---|---|---|---|
| January | 400 | 88 | 22.0% |
| February | 450 | 90 | 20.0% |
| March | 500 | 85 | 17.0% |
March brought the most buyers (500) and the lowest repeat rate (17.0%), which can mean the new customers came from a lower-intent source such as a heavy discount. The overall 20.0% would never show that. Pair repeat rate with customer tiers: RFM splits buyers by recency, frequency and amount, so the dashboard shows how many are loyal, new or slipping away. The definition of the metric itself is in repeat rate.
What are the common ecommerce dashboard mistakes?
| Mistake | What goes wrong | Fix |
|---|---|---|
| Revenue only | You see a drop but not where it came from | Show the factors beside revenue: sessions, conversion, order value |
| Mixing definitions | Two "conversion rates" on the same board differ for no real reason | One definition per metric, written on the tile |
| Counting refunds inside revenue silently | Revenue looks better than cash received | Show refunds as their own tile, or say how they are treated |
| No comparison | Is 3.50% good? Nobody can tell | Compare to last week and the 4-week median |
| Averages over mixed currencies | Order value jumps when the currency mix does | Convert to one base currency before averaging |
| Using a general cart-abandonment average as a target | Studies define it differently, so it is a poor target for your store | Track your own trend; use published averages only as context |
| Long board with 25 tiles | The row that matters is buried | Eight to ten numbers; the rest on a second page |
On the last-but-one point: the Baymard Institute's long-running tracker puts the average documented cart abandonment rate at 70.22% across 50 studies. That figure combines studies with different definitions of abandonment, so use it to sense-check an order of magnitude, not to set a target.
An ecommerce dashboard in TapCub
Take the week above, where checkout completion slipped from 75.0% to 70.0%. In TapCub it looks like this:
- Send the store events. Install the ecommerce / retail pack from All-platform analytics › Business › Industry packs. It expects
view_item,add_to_cart,begin_checkoutandpurchase(withorder_id,revenueandcurrency), and it writes the metrics, the purchase funnel and two dashboards, 电商经营 and 商品与转化 (the pack stores its names in Chinese). Reportpurchasefrom your server when payment succeeds, using the order number so retries are not counted twice. - Read the order numbers. All-platform analytics › Business › Commerce & revenue shows orders, buyers, average order value (revenue ÷ orders), repeat rate (people who bought at least twice ÷ buyers), the session-based purchase funnel, abandonment rate and the amount left in carts, and lifetime value grouped by first-purchase month. Revenue there is payment-success amount converted to the base currency; refunds are counted separately, not netted off.
- See the tiers. The same page has the RFM layers, with people moving between tiers compared with 30 days ago, which feeds the repeat row.
- Save the board. In All-platform analytics › Overview › My dashboards, put the cards in the order above and write each definition on a text card. Compare each number with the previous period using the board's date control.
- Keep the traffic row clean. Recognised bots and AI crawlers are counted separately in Web analytics › Bots by default, so the sessions in your top row are people.
What TapCub does not tell you is why checkout completion fell. It points to the step; you or your payment team still check the checkout itself. It also shows order amount, not your margin, so profit per order belongs in your own sheet. For marketing spend, import costs into All-platform analytics › Business › Channel ROI to see cost per click and return on ad spend next to the same orders.
FAQ
What should an ecommerce dashboard show?
Four things in the order a shopper moves: traffic (sessions), conversion (rate and funnel steps), order value (average order value, revenue per session) and repeat purchase (repeat rate, cohorts). Add a few top products and refunds. About eight to ten numbers is enough.
What are the most important ecommerce dashboard metrics?
Revenue, orders, conversion rate and average order value, because revenue is sessions × conversion rate × average order value. If revenue moves, one of the other three moved with it, and the funnel shows where.
How do you build an ecommerce dashboard?
Send purchase and funnel events with an order number, amount and currency, define each metric once, order the rows by the customer's path, and add a comparison to every number. Test it by asking a colleague why last week changed.
How often should I check an ecommerce dashboard?
A daily glance at four or five numbers for problems, a weekly review of all four rows to explain movements, and a monthly look at repeat rate and cohorts, which move slowly.
What is a good cart abandonment rate?
There is no single good rate: definitions differ, and published averages combine them. Track your own number against a trailing median and look for moves; in the example it rose from 54.5% to 57.6% because checkout completion fell.
See also: Retail Analytics Dashboard: A 10-Metric Layout With Formulas.
Sources
- Cart Abandonment Rate Statistics, Baymard Institute: the 70.22% average documented rate across 50 studies and the stated reasons for abandonment.
- Measure ecommerce, Google Analytics developer documentation: the standard ecommerce event names (view_item, add_to_cart, begin_checkout, purchase) and their parameters.
Was this article helpful?
We use your answers to fix and expand this page.
Couldn’t send. Please try again in a minute.
Thanks for the feedback. We’ll use it to improve this page.You’ve already sent feedback on this page. Thanks.

Customer Experience Consultant
Writes about live chat, visitor conversations, and self-service, sharing practical ways to make customer communication clearer and more effective.