Try it on your own data
Every report in this article is in the free plan. One snippet for web and apps, up to 10 sites.
Start freeEcommerce data analytics is the practice of turning store data into decisions, and it reduces to four families of numbers: traffic, conversion, basket size (AOV) and repeat purchase. They multiply into revenue, so when revenue moves you can find which one moved. This guide shows the identity, a sample month where traffic rose 15% and revenue still fell, and a diagnosis order you can reuse.
What you will learn
- Revenue = sessions × conversion rate × AOV; when revenue changes, split the change across those three factors before choosing a fix
- A blended conversion rate can fall while every channel stays flat: in the sample, paid social doubled its share of sessions and pulled the average from 2.50% to 2.00%
- Segment by channel and device first, then diagnose; track repeat purchase with a stated window and a stable customer ID
What does ecommerce data analytics actually measure?
Ecommerce data analytics sorts the data a store produces into four families, each answering one question about the money:
| Family | Question | Core metrics |
|---|---|---|
| Traffic | How many people arrive, from where? | Sessions, visitors, share by channel |
| Conversion | What share of them buy? | Conversion rate, add-to-cart rate, checkout completion |
| Basket | How much does each order bring in? | Average order value (AOV), items per order, refund rate |
| Repeat | Do buyers come back? | Repeat purchase rate, days between orders |
Everything else — dashboards, cohorts, predictions — is a more detailed view of one of these four. If a number on your report does not belong to a family, ask what decision it supports before you keep it. The lists of metrics themselves are in ecommerce KPIs; this guide is about how the four fit together and what to do when they disagree.
| Family | Question | Core metrics | Sample value |
|---|---|---|---|
| Traffic | How many people arrive, from where? | Sessions, share by channel | 46,000 sessions |
| Conversion | What share of them buy? | Conversion rate, add-to-cart rate | 2.00% |
| Basket | How much does each order bring in? | AOV, items per order, refund rate | $64.00 |
| Repeat | Do buyers come back? | Repeat purchase rate (90 days) | 17.0% |
Sample data: Month B of the worked example; repeat rate from 408 of 2,400 first-time customers.
How do the four families connect?
They multiply. For any period:
Revenue = sessions × conversion rate × AOV
Orders are sessions × conversion rate, and revenue is orders × AOV. Repeat behaviour is hidden inside it: a returning buyer is simply another session that converts, which is why the repeat family has its own metric — the formula alone cannot tell a loyal customer from a lucky ad click.
The identity gives you a decision rule. When revenue moves, ask which factor moved, in this order:
- Did sessions change? If yes, check which channels grew or shrank (see the traffic section).
- Did the conversion rate change? If yes, split it by channel and device before blaming the site.
- Did AOV change? If yes, look at the mix of products and discounts.
- Did none of them change? Then the difference is rounding, or something outside the data (a refund wave, a currency shift).
The next section works one case end to end.
Worked example: traffic rose 15%, revenue fell. Why?
Sample data for one store, two consecutive months:
| Month A | Month B | |
|---|---|---|
| Sessions | 40,000 | 46,000 |
| Orders | 1,000 | 920 |
| Conversion rate | 2.50% | 2.00% |
| AOV | $60.00 | $64.00 |
| Revenue | $60,000 | $58,880 |
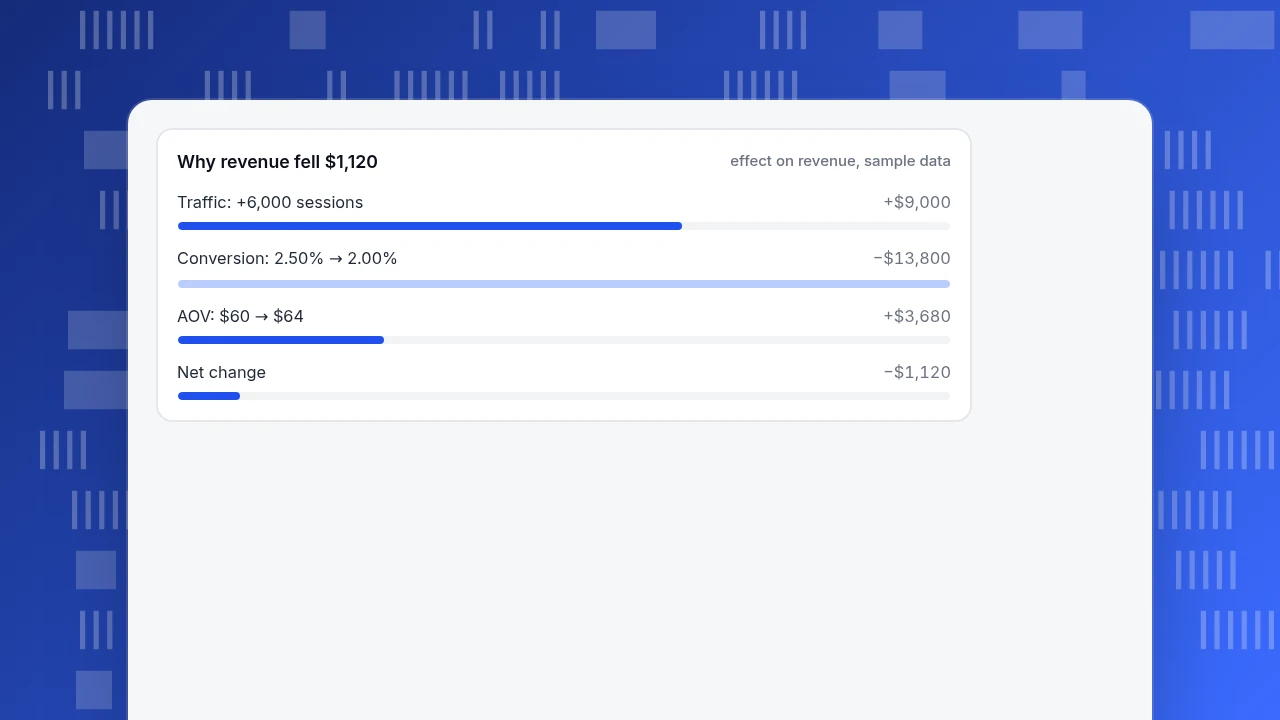
Revenue fell by $1,120 (−1.87%) even though sessions rose 15%. Split the change by factor, changing one factor at a time in the order traffic → conversion → AOV:
- Traffic effect: (46,000 − 40,000) × 2.50% × $60 = +$9,000
- Conversion effect: 46,000 × (2.00% − 2.50%) × $60 = −$13,800
- AOV effect: 46,000 × 2.00% × ($64 − $60) = +$3,680
The three add to +9,000 − 13,800 + 3,680 = −$1,120, exactly the change. (Order matters slightly: change the order and the split shifts a little, but the total never does.) So the headline is not "the site got worse"; it is "conversion fell faster than traffic grew." Now split by channel:
| Channel | A sessions | A rate | A orders | B sessions | B rate | B orders |
|---|---|---|---|---|---|---|
| Organic | 18,000 | 3.00% | 540 | 17,000 | 3.00% | 510 |
| Paid search | 10,000 | 2.00% | 200 | 10,000 | 2.00% | 200 |
| 4,000 | 5.00% | 200 | 3,000 | 5.00% | 150 | |
| Paid social | 8,000 | 0.75% | 60 | 16,000 | 0.375% | 60 |
| All | 40,000 | 2.50% | 1,000 | 46,000 | 2.00% | 920 |
Three of four channels converted at exactly the same rate in both months. The blended rate fell because paid social went from 20% of sessions (8,000 of 40,000) to 34.8% (16,000 of 46,000) while converting at a lower rate, and because the highest-converting channel, email, shrank. Without segmenting, a team would have redesigned the checkout. With it, the question becomes whether the extra 8,000 social sessions were worth their cost — a marketing question, not a site question.
Why revenue fell $1,120
effect on revenue, sample dataWhich traffic numbers can you trust?
The traffic family is the denominator for everything else, so errors here spread. Three checks:
- Bots out of the denominator. Crawlers and automated visitors inflate sessions and drag conversion down. Count them separately, not inside visitors.
- Channel rules written down. "Paid social" should mean the same thing in month A and month B; a changed UTM habit looks like a traffic change. Use consistent UTM parameters and review how unlabelled traffic is classified.
- Sessions, not just visitors. Conversion rate can be computed on either; pick one and say which. In the example above, every rate is orders ÷ sessions.
For scale, the US Census Bureau's quarterly estimate put retail e-commerce sales in the third quarter of 2026 at $347.3 billion, 17.9% of total retail sales (seasonally adjusted, not adjusted for price changes). That is context for the market, not a benchmark for your conversion rate: the figure measures sales, not store performance.
Where should you look for conversion problems?
Start with the funnel, then break it by the dimension most likely to differ. A common ecommerce order is view item → add to cart → begin checkout → purchase. Compute each step as a share of the step before, because a low overall rate hides which step leaks. Using the sample Month B, if 46,000 sessions produce 920 orders, the overall rate is 2.00%; the question is whether the loss sits at cart or at checkout, and that needs the step counts, not the total.
Then break the weakest step by:
- Channel — a social visitor and an email subscriber have different intent.
- Device — a checkout that works on desktop can fail on a phone.
- New vs returning — returning shoppers convert higher; a mix shift toward new visitors lowers the blended rate without any change in the site.
A broader treatment of the funnel stage by stage is in ecommerce analytics; the point here is to segment before diagnosing.
What can AOV tell you that conversion cannot?
AOV is revenue ÷ orders (see AOV). In the example it rose from $60.00 ($60,000 ÷ 1,000) to $64.00 ($58,880 ÷ 920). A rising AOV alongside a falling conversion rate is a pattern worth checking: it can mean the remaining buyers are higher-intent, or that a discount threshold or shipping minimum is pushing carts up while discouraging small orders. Look at items per order and the share of orders using a discount before treating a higher AOV as a win.
Two cautions. First, AOV is an average, so a handful of large orders can lift it; read the median order value next to it. Second, track refunds with the same discipline as purchases — an AOV computed on gross orders overstates what you keep.
How do you measure repeat purchase?
Repeat purchase rate is the share of customers who bought at least twice within a window. Sample data: 2,400 customers made a first purchase in a quarter; 408 of them bought again within 90 days. The repeat rate is 408 ÷ 2,400 = 17.0%. The same quarter's one-time buyers are the other 1,992 customers (83.0%) — the group a retention programme would target.
Always state the window (30, 60 or 90 days), because a 17.0% rate at 90 days is not comparable with a rate at 30. If you want to see it over time rather than as one number, a cohort view shows each month's first-time buyers and how many return each following month; see how to do cohort analysis for the method and cohort for the definition. Repeat analysis needs a stable customer identity, which means a login or customer ID, not just a cookie. Why bother: Harvard Business Review cites a commonly repeated range of 5 to 25 times as much to acquire a customer as to retain one, while noting that the range varies by study and industry and is not sourced; treat it as a direction, not a rule.
Which mistakes make ecommerce numbers misleading?
- Judging the blended conversion rate. The example shows a four-channel business whose rate fell 20% while three channels did not move.
- Mixing definitions. Revenue from an order ledger and "revenue" summed from a goal event are different numbers; do not compare them as one.
- Counting the same order twice. A purchase event fired on every page load of the confirmation page inflates orders and AOV drift. Dedupe on the order ID.
- Comparing unequal periods. A month with a promotion and a month without are not comparable; annotate the dates.
- Reading the average as the typical. Use a median next to AOV.
- Ignoring refunds. Gross revenue and net revenue can differ enough to flip a channel decision.
How to set this up in TapCub
Take the example above: a store whose revenue fell while traffic rose. In TapCub you would trace it like this.
- Send the commerce events. The e-commerce and retail industry pack at All-platform analytics › Business › Industry packs defines the events (
view_item,add_to_cart,begin_checkout,purchase,refund) and sets up order-count, AOV, add-to-cart-rate and refund-rate metrics, funnels and dashboards in one go. You still send the events yourself:purchaserequiresorder_id,revenueandcurrency. Send money events from the server with the order ID so they dedupe. - Read the funnel. In All-platform analytics › Behavior › Behavior analysis, build a funnel from view item to purchase. Each step shows the rate against the previous step, and the largest drop is marked; you can break it down by channel or device (the first layer of breakdown only).
- Check traffic by source. Web analytics › Sources shows visitors by channel, source and UTM. Real people and bots are counted separately, so crawlers do not sit inside your conversion denominator.
- Read orders and repeat buyers. All-platform analytics › Business › Commerce & revenue reads purchases and refunds from the order ledger, converted to your base currency; it also shows RFM segments, such as champions and at-risk buyers, with the change against 30 days earlier. Goal revenue (Business › Goals) sums a property on matching events and is not the order ledger, so do not compare the two.
TapCub reports what happened and which segment moved; it does not run the discount, the ad or the checkout redesign. Those stay in your store and ad tools.
FAQ
What is ecommerce data analytics?
It is the collection and interpretation of store data to guide decisions. In practice it means tracking four families — traffic, conversion, basket (AOV) and repeat purchase — and using the fact that revenue equals sessions × conversion rate × AOV to see which one moved when revenue changes.
What are the most important ecommerce metrics?
The four that multiply into revenue: sessions, conversion rate, AOV and repeat purchase rate. Others — cart abandonment, refund rate, margin — refine one of those. Pick a handful, define each in one sentence, and review them on a fixed schedule.
How do I find out why ecommerce revenue changed?
Split the change by factor (traffic, conversion, AOV), then split the weakest factor by channel and device. The sample above shows a $1,120 revenue drop: traffic +$9,000, conversion −$13,800, AOV +$3,680. The channel table then explained it — a mix shift into low-converting paid social.
Do small stores need ecommerce analytics?
Yes, but a small set. Track sessions by channel, conversion rate, AOV and repeat rate monthly, and annotate promotions. A small store gains the most from avoiding wrong conclusions, such as redesigning a page when only the traffic mix changed.
How is ecommerce analytics different from ecommerce reporting?
Reporting states what the numbers were; analytics asks why they moved and what to do. A report says conversion fell from 2.50% to 2.00%; analytics shows that three channels were flat and one channel's share doubled.
Sources
- U.S. Census Bureau. Quarterly Retail E-Commerce Sales, 3rd Quarter 2026 — retail e-commerce sales of $347.3 billion, 17.9% of total retail sales, seasonally adjusted. Read 2026-11-19.
- Gallo, A. The Value of Keeping the Right Customers. Harvard Business Review, October 2014 — why repeat customers matter in the economics of acquisition. Read 2026-11-19.
Was this article helpful?
We use your answers to fix and expand this page.
Couldn’t send. Please try again in a minute.
Thanks for the feedback. We’ll use it to improve this page.You’ve already sent feedback on this page. Thanks.

Data Engineer
Writes about event design, data quality, and collection workflows, with verifiable implementation methods for reliable analytics.