Try it on your own data
Every report in this article is in the free plan. One snippet for web and apps, up to 10 sites.
Start freeDTC (direct-to-consumer) marketing is how a brand attracts, converts and keeps customers it sells to directly, with no retailer between. It works when you own your customer data, because that lets you measure what a retailer would hide: what a new customer costs and whether they come back. Track acquisition cost, contribution per order, repeat rate and payback, by channel.
What you will learn
- Owning the customer record is what makes acquisition cost and repeat purchase measurable
- Judge acquisition on contribution margin, not revenue: in the example $32.50 per order against a $50 CAC
- State the repeat window and compute CAC with first-time customers only; cost per acquisition on purchases is not CAC
What is DTC marketing?
DTC (direct-to-consumer) marketing is how a brand attracts, converts and keeps customers that it sells to directly, with no retailer or wholesaler in between. The brand owns the storefront, the checkout, the customer list and the relationship. That ownership is the whole appeal, and it is also the catch: every job a retailer used to do for you (finding the shopper, closing the sale, bringing them back) now shows up as a cost and a number on your own books.
The core idea of this guide is simple: DTC marketing works when you own your customer data, because owning it lets you measure two things a retailer hides from you: what it costs to acquire a customer, and whether that customer comes back. Everything else (channels, creative, offers) is a way to move those two numbers. The table below sets out what you take on and the number that tells you whether it is working.
Related ground is covered elsewhere: the store-level metric list is in ecommerce KPIs, and how to build and use customer data you collect yourself is in first-party data strategy. This guide connects the two for a brand that sells direct, and names no brands.
| Job | A retailer used to carry | In DTC you carry | Number that shows if it works |
|---|---|---|---|
| Finding customers | Shelf traffic and footfall | Ads, search, email, content | CAC by channel |
| Closing the sale | The store and its staff | Your product page and checkout | Conversion rate, AOV |
| Delivering and returns | Wholesale logistics | Shipping, packaging, returns | Contribution margin per order |
| Bringing them back | The retailer's own customer list | Your own email and offers | Repeat rate, orders per customer |
| Knowing who bought | Aggregated sell-through | Every order and who placed it | First-party order record |
Each job moves from the retailer's books to yours; the right-hand column is the number that tells you it is paying back.
Which metrics tell you whether DTC marketing works?
Seven numbers cover most of it. Each has a formula you can compute from your own orders and your own ad spend. Compute them by channel as well as in total: a blended number hides the channel that loses money.
| Metric | Formula | What it tells you |
|---|---|---|
| Customer acquisition cost (CAC) | Marketing spend ÷ new customers | What one new customer costs. See CAC |
| Average order value (AOV) | Revenue ÷ orders | How much one order brings in. See AOV |
| Contribution margin per order | Order revenue − product cost − shipping − payment fees − returns allowance | What one order leaves to pay for marketing and overhead. See contribution margin |
| Repeat rate | Buyers with 2+ orders in a window ÷ buyers in that window | Whether customers come back. See repeat rate |
| Orders per customer | Orders in a window ÷ customers in the same window | How deep repeat buying goes |
| CAC payback | CAC ÷ contribution per customer per day (or month) | How long a new customer takes to pay for themselves. See CAC payback period |
| Return on ad spend (ROAS) | Revenue ÷ ad spend | A quick channel check; it ignores margin, so do not stop here |
A rule that keeps the set honest: use margin, not revenue, to judge acquisition. A $80 order that leaves $32.50 after costs is not an $80 customer.
Worked example: one channel's unit economics
Sample data: one paid channel in one month. Everything is recomputed below.
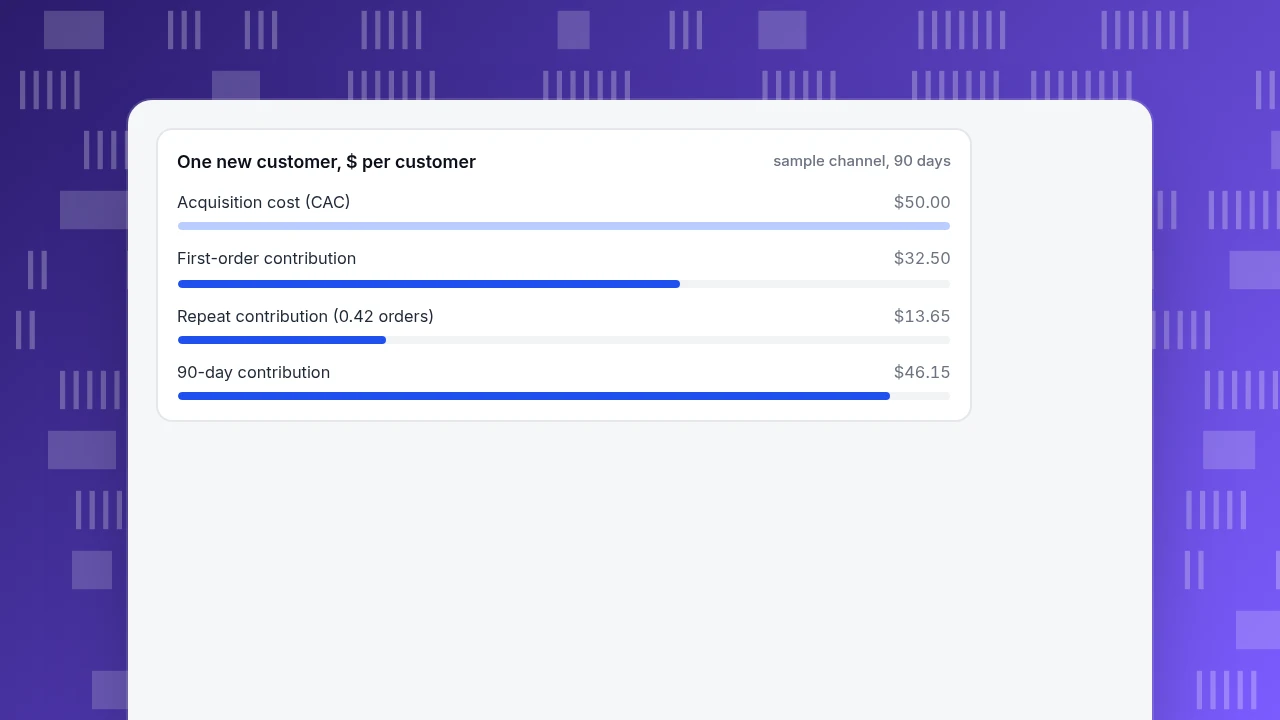
Acquisition. Spend of $30,000 brought 600 new customers: CAC = 30,000 ÷ 600 = $50.00.
First order. Average order value is $80 with a 55% product margin, so gross margin is 80 × 0.55 = $44.00. Shipping costs $9.00 and payment fees $2.50 per order, so contribution per order = 44.00 − 9.00 − 2.50 = $32.50. After acquisition cost, each new customer is 32.50 − 50.00 = −$17.50 on the first order, and the channel as a whole is 600 × (−17.50) = −$10,500 (check: 600 × 32.50 = 19,500 contribution against 30,000 spend).
Repeat. Of the 600 customers, 180 (30.0%) order again within 90 days, and those 180 place 252 further orders between them, 1.4 each (252 ÷ 180). Across all 600 customers that is 252 ÷ 600 = 0.42 extra orders per customer. At the same $32.50 contribution (assume retention marketing is free), repeat adds 0.42 × 32.50 = $13.65 per customer.
After 90 days. Contribution per customer = 32.50 + 13.65 = $46.15, against a CAC of $50.00: still −$3.85 per customer.
Payback. The deficit after the first order is $17.50. If repeat contribution keeps arriving at the 90-day pace (13.65 ÷ 90 = $0.1517 a day), payback is 17.50 ÷ 0.1517 ≈ 115 days. That is an extrapolation; check it against the next cohort before you plan cash around it.
Which lever matters most? Change one input at a time and look at the 90-day result:
| Change | New 90-day contribution per customer | vs CAC $50 |
|---|---|---|
| Base case | $46.15 | −$3.85 |
| CAC falls to $45 | $46.15 | +$1.15 |
| Extra orders rise from 0.42 to 0.56 | $50.70 | +$0.70 |
| AOV rises from $80 to $85 | $50.06 | +$0.06 |
Cutting CAC by $5 helps most here, but growing repeat orders by a third delivers about 60% as much (0.70 ÷ 1.15) and does not depend on ad auctions. The point of the table is not the winner; it is that you can only run it if you know your own repeat behaviour.
One new customer, $ per customer
sample channel, 90 daysWhy does owning your customer data matter in DTC?
A retailer shows you wholesale orders. A DTC brand sees every order, who placed it, when, from which source and whether they returned. That first-party record is what makes the example above computable. Three things follow.
- You do not have to rely on a platform's own report. Ad platforms report the conversions they believe they caused, with their own windows and rules. Your own order record, joined to a source you captured on the visit, is the cross-check. Compare the two before trusting either.
- Signal can disappear. Apple's App Tracking Transparency framework requires an app to ask for permission before tracking people across other companies' apps and websites. Where people decline, the platform sees less than you do. A brand that records its own orders is less affected.
- Collecting it has rules. Under the GDPR, consent (where you rely on it) must be freely given, specific, informed and unambiguous (Article 4(11)), and it must be as easy to withdraw as to give (Article 7(3)). Owning data means owning responsibility for it. Nothing in this guide is legal advice.
What to hold in your own order record: order id, a customer identifier (hashed email or login id), order date, items, amounts, discount used, first-touch and last-touch source, and whether it is the customer's first order. That is enough to compute CAC, repeat rate and cohorts.
How should you read repeat purchase and customer segments?
Repeat purchase is the number that turns acquisition cost into a plan. Read it three ways.
- Rate in a fixed window. In the example 30.0% of new customers ordered again in 90 days. Always state the window; a 30-day and a 12-month rate are not comparable.
- By acquisition cohort. Group customers by first-purchase month (or by first channel) and compare their repeat rates. If customers acquired with a heavy discount repeat less than the others, the discount bought a one-off sale, not a customer.
- By tier. RFM splits buyers by recency, frequency and monetary value into groups such as champions, loyal, new, at risk and dormant. Use it to decide who gets a retention message and who is already lost.
A simple decision rule: if CAC is higher than 90-day contribution per customer (as in the example), you are financing growth and need cash to cover the gap until payback. If it is lower, the channel is paying for itself inside the window.
What are the common DTC marketing measurement mistakes?
| Mistake | What goes wrong | Fix |
|---|---|---|
| Blended CAC only | A channel that loses money hides behind one that does not | Compute CAC per channel and per campaign |
| Judging by revenue, not margin | A high-AOV order with low margin looks like a good customer | Subtract product cost, shipping, fees and returns |
| Counting repeat orders as new customers | CAC looks lower than it is | Divide spend by first-time customers only |
| Mixing repeat windows | A 12-month rate beside a 30-day rate | Fix one window and print it on every tile |
| Trusting platform-reported conversions alone | Platforms credit themselves | Cross-check against your own order record |
| Chasing discounts | First orders rise, repeat falls | Compare repeat rate by discount used |
| Reporting only averages | The loss in one segment is invisible | Cut by channel, cohort and tier |
DTC metrics in TapCub
Take the example above, where CAC is $50 and the channel loses $17.50 on the first order. In TapCub the steps look like this:
- Send your orders. Report
purchasefrom your server when payment succeeds, with order id, amount and currency, and calltapcub.loginwhen someone signs in so orders belong to a person and not just a device. The order table then feeds All-platform analytics › Business › Commerce & revenue. - Import your spend. In All-platform analytics › Business › Channel ROI, add costs by day, channel, source and campaign (a CSV or row by row). The page shows cost per click (spend ÷ sessions), cost per acquisition (spend ÷ conversions, where conversions are purchases on the order table) and return on ad spend (revenue ÷ spend), grouped by channel, source or campaign.
- Mind the difference between the two cost numbers. TapCub's cost per acquisition divides by purchases, including repeat orders. If that month had 750 purchases (600 first orders plus 150 repeat orders from earlier customers), spend ÷ purchases is 30,000 ÷ 750 = $40, not the $50 CAC. Use the number of first-time buyers as your denominator when you want true CAC.
- Read repeat and tiers. Commerce & revenue shows the repeat rate (people who bought at least twice ÷ buyers), lifetime value grouped by first-purchase month and the RFM layers with movement compared with 30 days ago. Under All-platform analytics › Users › Segments & tags, an RFM segment can be recomputed daily and used in funnels and retention.
- Keep bots out. Recognised bots and AI crawlers are reported separately, so they do not inflate the sessions behind cost per click.
TapCub measures; it does not run any of the marketing. It does not send email, place or bid on ads, score leads or run a CRM. The order table holds order amounts, not your product cost or shipping, so contribution margin and payback are calculated in your own model.
FAQ
What is DTC marketing?
DTC (direct-to-consumer) marketing is how a brand promotes and sells straight to customers, without a retailer or wholesaler in between. The brand owns the storefront, the customer list and the data, which makes acquisition cost and repeat purchase measurable.
What are the key DTC marketing metrics?
Customer acquisition cost, average order value, contribution margin per order, repeat rate, orders per customer and CAC payback. Return on ad spend is a quick channel check, but it ignores margin.
How do you calculate CAC for a DTC brand?
Divide marketing spend by the number of new customers it brought in: $30,000 ÷ 600 = $50 in the example. Count first-time customers only, and compute it per channel as well as in total.
Why is repeat purchase important in DTC?
Because the first order often does not cover acquisition cost. In the example the first order left $32.50 against a $50 CAC; repeat orders closed part of the gap, and payback arrived at about 115 days if the pace held.
How is DTC marketing different from B2C marketing?
B2C covers selling to consumers by any route, including through retailers. DTC is the subset where the brand sells directly and holds the customer data, so it carries the acquisition and retention costs itself.
Sources
- App Tracking Transparency, Apple Developer Documentation: the framework that requires an app to ask permission before tracking people across other companies' apps and websites.
- Regulation (EU) 2016/679 (GDPR), Articles 4 and 7, EUR-Lex: the definition of consent and the condition that withdrawing it must be as easy as giving it.
Was this article helpful?
We use your answers to fix and expand this page.
Couldn’t send. Please try again in a minute.
Thanks for the feedback. We’ll use it to improve this page.You’ve already sent feedback on this page. Thanks.

Product Adoption Consultant
Explores customer onboarding, live conversations, and self-service, turning common usage questions into practical guidance and improvements.