Try it on your own data
Every report in this article is in the free plan. One snippet for web and apps, up to 10 sites.
Start freeWhat successful digital transformation case studies share is that they fix the metric first: a quantified outcome, a written definition, a baseline and an owner agreed before the project starts and kept fixed while it runs. BCG found about 70% of transformations fall short of their goals. This guide shows the common traits, six checks for reading any case study's numbers and a metric card.
What you will learn
- Credible cases fix the metric first: outcome, definition, baseline, owner, review date
- Read every case number for its definition, denominator, baseline, exclusions and cost
- A claim can be accurate and misleading: a 60% drop on the new workflow was 12.0% across all orders, and a net loss after cost
What do digital transformation case studies actually show?
Most published digital transformation case studies are written by the company that sold the technology or the consultancy that ran the project. They tend to report a handful of favourable outcomes, in round numbers, with the definition, the baseline and the cost left out. That does not make them worthless, but it does mean the useful question is not "which company did what" but "which of these claims could I check, and what do the credible ones have in common".
This article names no companies and invents no cases. It does two things instead: it reads what the research says successful programmes share, and it gives you a way to read any case study's numbers and to set up your own. The common thread is one rule: successful transformations fix the metric first. They agree what is being measured, how, against which baseline and who owns it before the project starts, and they keep it fixed while the project runs.
The scale of the problem is worth stating. BCG's research with 825 senior executives found that about 70% of digital transformations fall short of their objectives, and that getting six factors right raises the odds of success to about 80%. Two of those six are about measurement: clear, quantified goals set up front, and effective monitoring of progress against defined outcomes. If you are planning your own programme, data maturity model shows where to start, and data strategy covers what to do with the data once you are measuring it.
What do successful transformations have in common?
The table lists seven traits. The first six trace to the BCG findings or to ordinary good practice (marked in the last column); each row also gives the question to ask when you read a case study. A case study that is silent on a row is telling you something.
Notice what is not in the table: a specific technology. Cases differ wildly on tools and are alike on discipline. In other words, a fixed metric with an owner and a baseline will not make a poor project good, but the lack of one makes it impossible to tell whether a good project worked.
| Trait | In a credible case you will see | Question to ask | Source |
|---|---|---|---|
| Quantified outcome up front | One business number with a target | What was the target before the project started? | BCG factor: clear, quantified goals |
| Leadership commitment | A named senior sponsor who reviews the number | Who signs this number? | BCG factor: leadership commitment |
| Monitoring against defined outcomes | A regular review of the same metric | How often is it reviewed, and by whom? | BCG factor: effective monitoring |
| One source of truth | Metrics from one dataset with written definitions | Where does this number come from? | BCG: single source of data for tracking |
| Baseline | A before figure over weeks, not a day | What was it before, over what dates? | Good practice (this guide) |
| Cost counted | Run cost netted against savings | What did it cost to run each month? | Good practice (this guide) |
| Guardrail | A second metric that must not worsen | What got worse while this improved? | Good practice (this guide) |
A case study that is silent on a row is telling you something.
How do you read the numbers in a case study?
Apply six checks to any claim. Each check has an "if … then …" rule you can apply in a minute.
- What exactly is the metric? If the definition is not given, treat the number as unverified. "Faster processing" could be the mean, the median or the best day.
- What is the denominator? If the claim is an average, ask over which items. If the hard cases were moved elsewhere, the average improves while the work does not (the worked example below).
- What is the baseline, and over what period? If there is no "before" number, there is no improvement, only a figure. Look for at least several weeks of baseline, not one good week.
- What is excluded? If anything was left out (exceptions, a pilot group, a quiet season), the claim applies only to what was counted.
- What did it cost? If hours saved are claimed with no tool, licence or run cost, compute the net yourself.
- Is it an output or an outcome? "We launched 12 new workflows" is an output. "Cost per order fell" is an outcome. If only outputs are reported, ask for the outcome.
A seventh check is about time. A result measured at three months may not hold at twelve, so read the window the claim covers, and prefer a metric that is still reported later.
Worked example: the 60% that was 12%
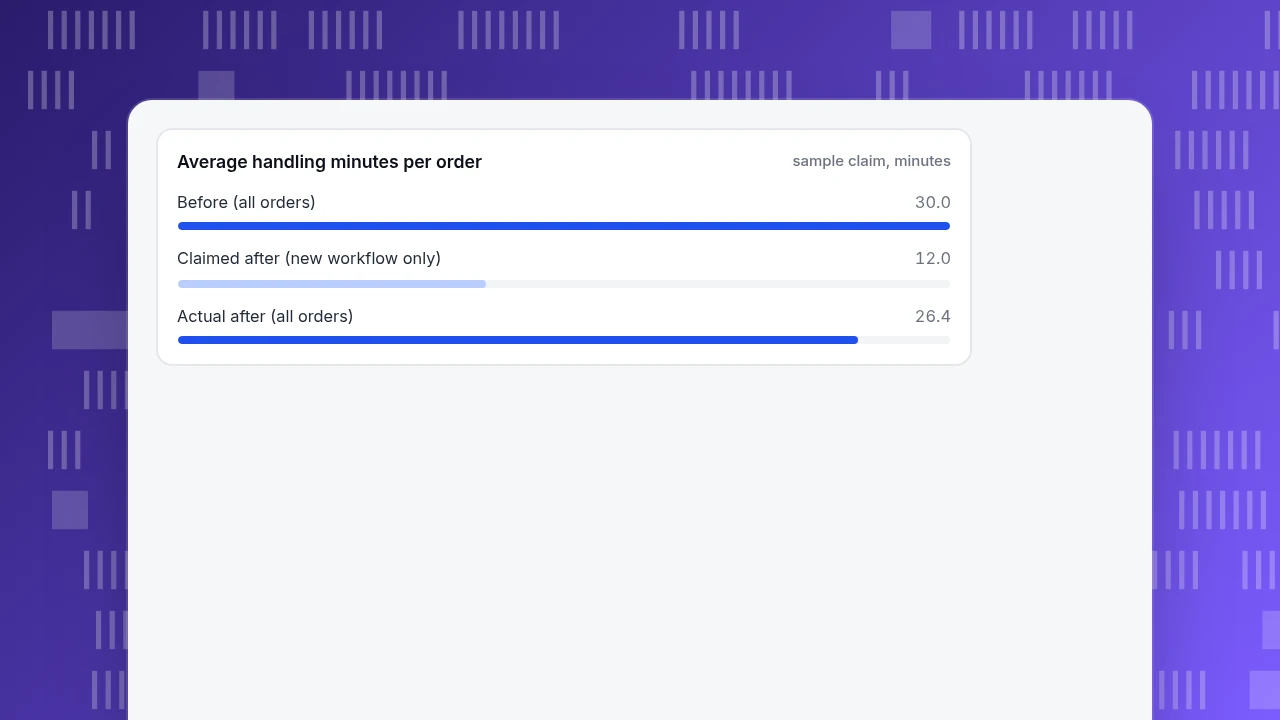
Sample data: a company claims a case-study headline of "average order handling time cut by 60%". It is not a real case; it is built to show how a claim can be accurate and misleading at once.
Before. 1,000 orders a month, each taking 30 minutes of staff time: 1,000 × 30 = 30,000 minutes = 500 hours.
After. The new workflow handles 700 orders at 12 minutes each. The other 300 orders turn out to be exceptions and are moved to a manual review team at 60 minutes each.
- New workflow: 700 × 12 = 8,400 minutes.
- Manual review: 300 × 60 = 18,000 minutes.
- Total: 8,400 + 18,000 = 26,400 minutes = 440 hours.
The claim. The case study reports only the new workflow: 12 minutes against 30 is a drop of (30 − 12) ÷ 30 = 60%.
The full picture. Across all 1,000 orders the average is 26,400 ÷ 1,000 = 26.4 minutes, a drop of (30 − 26.4) ÷ 30 = 12.0%. Staff hours fall from 500 to 440, a saving of 60 hours.
The cost. At $28 an hour, 60 hours saved is 60 × 28 = $1,680 a month. If the new tool costs $2,400 a month to run, the net is 1,680 − 2,400 = −$720 a month. The headline said 60%; the books say a loss.
Nothing in the 60% was false. The denominator was the problem: the metric was defined to cover only the orders the new workflow handled. Had the metric been fixed up front as "total staff minutes per order received, including exceptions", the project would have shown 12.0% on day one, and the conversation would have been about how to bring the exceptions down.
Average handling minutes per order
sample claim, minutesHow do you fix the metric before you start?
Use a metric card, one per outcome, filled in before the project begins. Five steps:
- Choose one outcome. One business result, in the units the business uses: minutes per order, share of orders completed, resolved conversations, revenue per visitor. Not "digital maturity".
- Define it in one sentence, including the denominator and what is excluded. "Total staff minutes on orders ÷ all orders received, exceptions included."
- Take a baseline over enough time to cover normal variation, at least four to eight weeks, and write down the number and the dates.
- Add a guardrail. A second metric that must not get worse while the first improves, such as error rate or customer complaints.
- Name an owner and a review date. One person signs the number, and you look at it on a calendar date, not when someone remembers.
An example card for the case above:
| Field | Entry |
|---|---|
| Outcome | Staff time per order |
| Definition | Total staff minutes on orders ÷ all orders received, exceptions included |
| Baseline | 30.0 minutes (8 weeks before go-live) |
| Target | 24.0 minutes by month 6 (−20%) |
| Guardrail | Orders needing correction at most 2% |
| Cost line | Run cost of the tool, counted monthly against hours saved |
| Owner and review | Operations lead; monthly |
A fixed metric set is not new. The DORA research programme publishes a small, fixed set of software delivery metrics with written definitions (for example, change lead time is the time from a change being committed until it is deployed in production), so teams can compare themselves over time. The lesson carries over: choose a few metrics, define each in a sentence and do not change them mid-project.
What are the common mistakes with transformation metrics?
| Mistake | What goes wrong | Fix |
|---|---|---|
| Defining the metric after the project | The metric gets chosen to flatter the result | Write the card before kickoff and date it |
| No baseline | "Improved" cannot be shown | Capture four to eight weeks first |
| Averaging over what was easy | Hard cases drop out of the denominator | Count every item that entered the process |
| Tracking outputs, not outcomes | Workflows launched, nothing measured | Pair each output with an outcome |
| Ignoring cost | Savings look positive until run cost is added | Put cost on the card and net it monthly |
| No guardrail | The metric improves by hurting something else | Add one metric that must not worsen |
| Changing the metric mid-way | Before and after become incomparable | Change only with a dated note and a recomputed baseline |
| Copying another company's results as a target | Their context, scope and definition differ | Set targets from your own baseline |
Measuring a transformation in TapCub
Take a transformation that moves a customer-facing step online, such as checkout, sign-up or support. In TapCub the metric card maps like this:
- Define the event. In All-platform analytics › Data › Tracking plan, record the event that counts as the outcome (for example completed purchase), with its trigger, required properties, an owner and a status. That is the written definition from step 2 of the framework.
- Make it a goal. In All-platform analytics › Business › Goals, an event goal counts completions. Note the denominator here: the conversion rate is goal completions ÷ unique visitors in the range, not sessions, so write that on the card as well. This is the same lesson as the 60% example.
- Mark go-live. Add the date in Configuration › Annotations, and take the weeks before it as the baseline using the previous-period comparison. The funnel in All-platform analytics › Behavior › Behavior analysis shows which step moved.
- Watch the guardrail. Monitoring › Errors shows error count and error rate; an alert in All-platform analytics › Operations › Monitors can notify you when a metric crosses a line, with a dry run that tells you how often it would have fired in the past 30 days. For a support change, Live chat › Reports shows resolution rate and first response time, and its conversion attribution compares visitors who chatted with those who did not.
- Keep traffic honest. Bots and AI crawlers are reported separately from people by default, so a change in bot traffic cannot be mistaken for a change in customers.
What TapCub does not measure is staff time per order or any internal workflow. Unless you send it as an event, TapCub sees customer behaviour on the website, app, mini-program and in chat. It also does not run the project: it measures what the project changed for customers, against the baseline you fixed.
FAQ
What do successful digital transformation case studies have in common?
They fix the metric before the project: a quantified outcome, a written definition, a baseline, a named owner and a review rhythm. BCG's research lists clear quantified goals and effective monitoring of progress against defined outcomes among six success factors.
How many digital transformations succeed?
BCG's research with 825 senior executives found that about 70% fall short of their objectives. The same research says getting six factors right raises the odds of success to about 80%.
How do you measure digital transformation success?
Choose one outcome in business units, define it in a sentence with its denominator, take a baseline of four to eight weeks, add a guardrail metric, count the cost and review it on a fixed date. The metric card above is one way to write it down.
Why should you be careful with case study numbers?
Many are published by vendors or consultants and report round figures without the definition, baseline or cost. The example showed a 60% claim that was 12.0% across all orders and a net loss after run cost.
What is the difference between an output and an outcome?
An output is something you delivered (a new workflow, a launched app). An outcome is what changed for the business (staff time per order, completed checkouts). Case studies often report outputs; decisions need outcomes.
Sources
- Flipping the Odds of Digital Transformation Success, Boston Consulting Group (2020): the 70% shortfall finding, the survey of 825 senior executives and the six success factors.
- DORA software delivery metrics, dora.dev: written definitions for a fixed set of delivery metrics, including change lead time.
Was this article helpful?
We use your answers to fix and expand this page.
Couldn’t send. Please try again in a minute.
Thanks for the feedback. We’ll use it to improve this page.You’ve already sent feedback on this page. Thanks.

Product Experience Specialist
Explores usability, user journeys, and feature adoption through practical examples of onboarding and everyday product use.