Try it on your own data
Every report in this article is in the free plan. One snippet for web and apps, up to 10 sites.
Start freeTo create a digital marketing strategy, set a goal as a metric, a number and a date, work backwards to the visits and conversions you need, choose channels by planned cost per order against a break-even ceiling, tag every link, and review on a fixed rhythm with a written rule for what to cut. The worked example below turns a goal of 400 orders into a channel plan and shows how a healthy average can hide two unprofitable channels.
What you will learn
- State the goal as a metric, a number and a date; add a weekly leading indicator
- Work backwards: orders ÷ conversion rate = visits needed; margin per order = cost ceiling
- Judge channels by cost per order, not the blended average, and write the rule that triggers a cut
What is a digital marketing strategy, and what is it not?
A digital marketing strategy is a written plan that links a business goal to numbers: which audience, which channels, what budget, what you will measure and when you will review it. It is not a list of platforms to post on, and it is not a campaign. Campaigns and posts are tactics; the strategy is the reason you picked those tactics and the rule for dropping them.
The order matters, and most plans get it backwards by choosing channels first. The sequence this guide follows is: goal and number, then the arithmetic, then channels, then tracking, then a review rhythm. A plan that follows it can answer, in one sentence, "what would make us change course?" A plan that does not follow it can only answer "we posted three times a week".
For the numbers you will track along the way, see marketing KPIs; for how the stages of the buyer's path fit together, see marketing funnel; and for the reporting layer, see marketing analytics.
How do you turn a business goal into a marketing target?
State the goal as a metric, a number and a date. Google's re:Work guidance on objectives and key results (OKRs) frames this as an ambitious objective paired with measurable key results, and the same shape works for a marketing plan. Use this table to translate:
| Business goal | Marketing metric | Example target | Leading indicator (weekly) |
|---|---|---|---|
| Grow online sales | New-customer orders | 400 orders a month by Q4 | Sessions from target channels, add-to-cart rate |
| Grow sign-ups | Sign-ups from marketing | 1,200 a month by June | Landing page conversion rate |
| Reduce acquisition cost | Cost per order by channel | At or below $30 | Click cost, conversion rate per channel |
| Build a pipeline | Demo requests from target accounts | 80 a month | Visits to pricing and demo pages |
A target with no date or no number is a wish. A leading indicator is something you can see in days, unlike the outcome, which may take weeks, so you can steer before the quarter ends.
| Business goal | Marketing metric | Example target |
|---|---|---|
| Grow online sales | New-customer orders | 400 orders a month by Q4 |
| Grow sign-ups | Sign-ups from marketing | 1,200 a month by June |
| Reduce acquisition cost | Cost per order by channel | At or below $30 |
| Build a pipeline | Demo requests from target accounts | 80 a month |
A goal with no number or no date cannot be reviewed.
How many visits do you need? Work backwards
Do the arithmetic before you pick channels. Sample data for an online store:
- Goal: 400 new-customer orders a month.
- Average order value: $75. Gross margin: 40%, so each first order earns $75 × 40% = $30 of margin.
- Allowed cost per order: $30 to break even on the first order. Repeat purchases, if you can show them, raise this ceiling; without evidence, use $30.
- Visits needed at a blended 2.5% conversion rate: 400 ÷ 0.025 = 16,000 visits a month.
Now the plan has a shape: 16,000 visits, at most about $12,000 of spend (400 × $30), and a test for every channel: does it deliver visits at a cost per order under $30?
Who is the plan for? Pick one segment first
A strategy aimed at "everyone" gets average results from every channel. Choose one primary segment, using the revenue you already have. Sample data for the store, last quarter:
| Segment | Orders | Average order | Revenue | Share of revenue |
|---|---|---|---|---|
| Home-office workers | 520 | $75 | $39,000 | 54.2% |
| Small offices | 140 | $130 | $18,200 | 25.3% |
| Students | 300 | $49 | $14,700 | 20.4% |
Total: 960 orders and $71,900, an average order of $74.90, which is the $75 used above. Home-office workers are the largest pool, so they are the primary segment for the first quarter; small offices have the highest order value and deserve a small test budget. Write down, for the primary segment, the problem they are trying to solve, where they look for answers and what offer you make. Channel choice follows from that, not the other way round.
Which channels earn a place in the plan?
Plan each channel with visits, an expected conversion rate and a cost, then compute the cost per order. Sample plan:
| Channel | Visits | Conversion | Orders | Monthly cost | Cost per order |
|---|---|---|---|---|---|
| Organic search (content) | 6,000 | 2.0% | 120 | $2,000 | $16.67 |
| Paid search | 4,000 | 3.0% | 120 | $6,000 | $50.00 |
| Email to existing list | 3,000 | 5.0% | 150 | $500 | $3.33 |
| Social posts | 3,000 | 1.0% | 30 | $1,500 | $50.00 |
| Total | 16,000 | 2.6% | 420 | $10,000 | $23.81 |
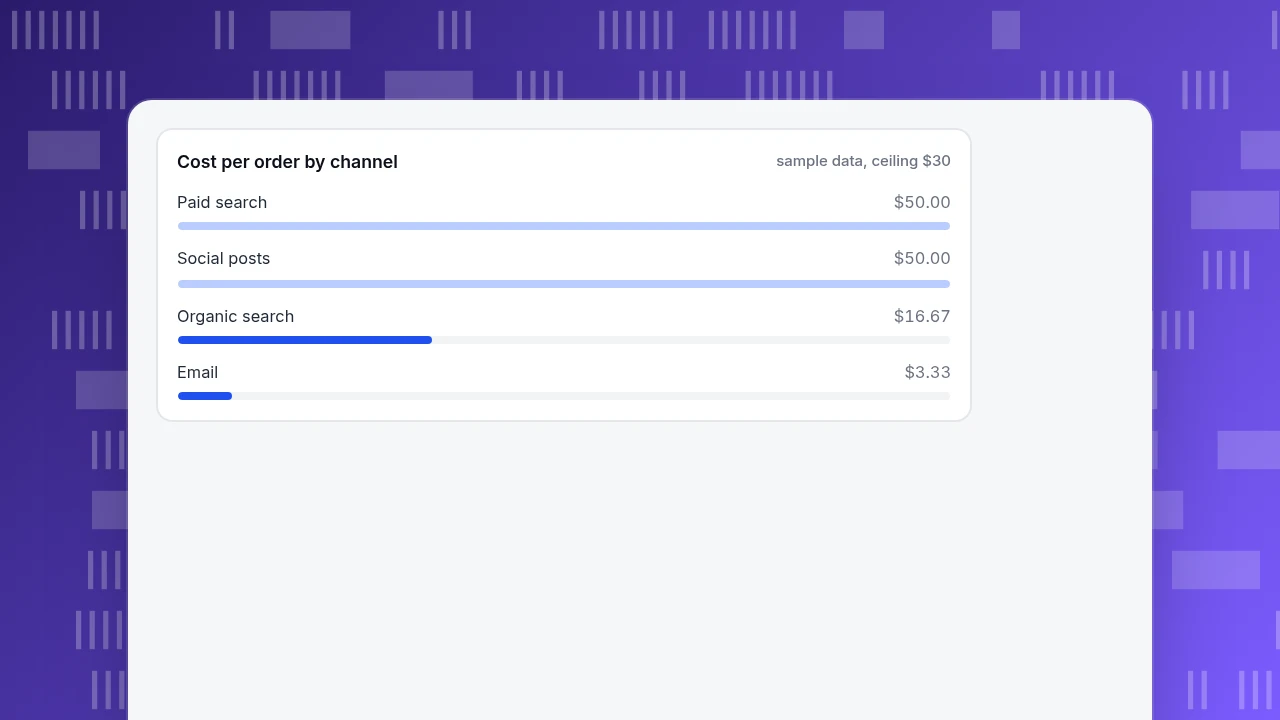
The plan reaches 420 orders (target 400) at an average of $23.81 per order, under the $30 ceiling. But the average hides a split: organic search and email are well under $30, while paid search and social cost $50 per first order, $20 above the ceiling. Decision rules fall out of that:
- Keep and grow channels under the ceiling.
- Test and cap channels over it: allow them only if repeat purchase evidence justifies a higher ceiling, and cap their spend.
- Do not judge by total only. A healthy blended figure can carry two unhealthy channels.
All conversion rates here are planning assumptions, and the first month's real numbers replace them.
Cost per order by channel
sample data, ceiling $30How do you set up tracking so the plan can be checked?
A plan is only as good as the data you can read against it. Two rules:
- Every link you control carries campaign tags. UTM parameters (source, medium, campaign) are the standard way to tell channels and campaigns apart; Google's guidance on custom campaign URLs lists the parameters and shows how to build them. Keep a naming convention and write it down.
- Define the outcome event once. Orders, sign-ups or demo requests are one named event or one page, counted the same way in every report.
A convention that works:
| UTM field | Rule | Example |
|---|---|---|
| utm_source | Where the click came from, lower case | newsletter, google |
| utm_medium | The type of channel | email, cpc, social |
| utm_campaign | Plan name plus month | spring-sale-2027-03 |
Inconsistent names (Email, email, e-mail) split one channel across three rows and ruin the cost-per-order table above.
What review rhythm keeps the strategy honest?
Set the rhythm when you write the plan. A simple version:
| Cadence | Look at | Decision it can trigger |
|---|---|---|
| Weekly | Leading indicators: sessions, conversion rate by channel | Fix a broken page or tag; no budget changes |
| Monthly | Orders, cost per order, by channel | Pause a channel above ceiling for two months in a row |
| Quarterly | Goal progress, mix of channels | Move 10 to 20% of budget from the weakest channel to the strongest |
Write at least one explicit rule, for example: "If paid search stays above $30 cost per order for two consecutive months, cut its budget by 25% and move it to email and content." The rule matters more than the exact numbers, because it turns the review into a decision rather than a discussion.
What are the most common digital marketing strategy mistakes?
- Targeting everyone. With no primary segment the message stays generic, and every channel returns average results at best.
- Skipping the margin check. A channel that wins orders at a cost above the margin per order grows revenue while shrinking profit.
- Choosing channels before the goal. "We need TikTok" is a tactic, not a strategy.
- A goal with no number or date. "Grow awareness" cannot be reviewed.
- Judging by the blended average. Paid and social can lose money while the total looks fine.
- Inconsistent tags. One channel split into several names makes channel numbers unreadable.
- No review rule. Without a stop condition nothing is ever cut.
- Copying another company's mix. Their margin, price and audience are not yours.
- Annual plan, no check-ins. Six months in, the assumptions are stale.
How to track a digital marketing strategy in TapCub
Take the store above. TapCub measures what visitors do after they arrive and what each channel cost per order; it does not buy ads, send email or publish content, so the channels themselves run in their own tools. The steps:
- See visits by channel. Web analytics › Sources shows visitors by channel, source and UTM parameters; the channel rules can be configured. Use your UTM convention so the rows match the plan.
- Count the outcome. Create the goal in Web analytics › Goals (it is the same data as All-platform analytics › Business › Goals) and read the goal rate per source.
- Compute cost per order. In All-platform analytics › Business › Channel ROI, import spend by day, channel, source and campaign (CSV or row by row). The page shows cost per click (spend ÷ sessions), cost per acquisition (spend ÷ purchases on the order ledger) and return on ad spend, grouped by channel, source or campaign. That is the table above, filled in with real numbers.
- Check who gets the credit. In All-platform analytics › Behavior › Behavior analysis, choose first, last, linear, position and time-decay together and read them side by side; the channel that only assists shows up in the gap between columns. The lookback window is 30 days by default.
- Mark and watch. Add an annotation in Configuration › Annotations for each launch, and create a monitor in All-platform analytics › Operations › Monitors on a metric such as sessions or error rate so a sudden drop is reported; monitors only notify, they do not change anything.
- Know the boundary. TapCub does not run campaigns, bid or optimise ads and does not set budgets. It gives you the numbers for the monthly decision.
FAQ
What are the steps to create a digital marketing strategy?
Set a goal with a number and a date, work backwards to the traffic and conversions you need, choose channels by planned cost per outcome, tag everything, and set a review rhythm with explicit rules for what to cut.
What are the 5 components of a digital marketing strategy?
Sources vary. A practical list is goals, audience, channels, budget and measurement. This guide adds a sixth, the review rule, because without it a plan does not change when the numbers say it should.
How do you choose digital marketing channels?
Plan each channel's visits, conversion rate and cost, then compute cost per order against your break-even ceiling. Channels under the ceiling earn growth; channels over it are capped or tested. Do not choose by where competitors are.
How much should I spend on digital marketing?
Start from the goal: orders needed times the cost per order you can afford. In the sample, 400 orders at a $30 ceiling gives about $12,000 a month. Raise or lower it using the real cost per order after the first month.
How often should I review my digital marketing strategy?
Check leading indicators weekly, outcomes and cost per channel monthly, and goal progress and the channel mix quarterly. Write at least one rule for when a channel gets cut or grown.
Sources
- Google re:Work. Set goals with OKRs. Objectives paired with measurable key results.
- Google Analytics Help. URL builders: collect campaign data with custom URLs. Campaign parameters for tagging links.
Was this article helpful?
We use your answers to fix and expand this page.
Couldn’t send. Please try again in a minute.
Thanks for the feedback. We’ll use it to improve this page.You’ve already sent feedback on this page. Thanks.

Product Analyst
Focuses on event analysis, conversion funnels, and retention, using clear metric definitions and structured analysis to explain product performance.