Try it on your own data
Every report in this article is in the free plan. One snippet for web and apps, up to 10 sites.
Start freeReal-time web analytics is a live view of who is on your site now, over a window of minutes, with a delay of a few minutes. Use it to detect and confirm: a launch, a campaign going live, an outage. Do not use it to judge performance, because live numbers are provisional and small samples make a live conversion rate swing wildly.
What you will learn
- Real time answers 'is it working right now?'; finished reports answer 'how did it perform?'
- A conversion rate over 120 visitors can be anywhere from 0.9% to 7.1% with 95% confidence; use longer windows to judge
- For outages compare with the same weekday and time and require two bad readings in a row
What does real-time web analytics actually show?
It shows who is on your site now and what they are doing, over a window of minutes, not a finished day. Typically that means a count of active visitors, the pages and sources they are on, and a feed of the latest events. It is a live view for checking that something is happening, not a report for deciding what worked.
The reason to separate the two is that a live view and a finished report answer different questions. Real time answers "is it working right now?" in a few minutes. A daily report answers "how did it perform?" after the data has been processed and settled. Mixing the two is where most mistakes with real-time numbers come from. The short version of the rest of this article: use real time to detect and confirm, and use finished reports to judge. The term itself is defined in realtime.
How fast is "real time", and how fast are the other reports?
"Real time" is a window and a delay, and both are small but not zero. As a reference point from a widely used hosted analytics product, Google's documentation lists these typical processing times for standard properties:
| Report layer | Typical delay | Window or note |
|---|---|---|
| Realtime | A few minutes | Shows users active in the last 5 minutes and the last 30 minutes |
| Standard intraday | 2–6 hours | Most reports and API queries |
| Daily | 12 hours | All reports |
| Final settled data | Up to 24–48 hours | Google says data in reports may change while processing |
Source: Google Analytics Help, "Data freshness" and "Realtime report" pages. App data is also batched to conserve battery, which Google says adds delays on the order of minutes. Two implications follow whichever tool you use:
- A real-time view is provisional. Numbers you read now can change once processing finishes, so do not copy them into a report.
- The delay is not the same for every view in one tool. Check which layer you are looking at before comparing two numbers.
TapCub's own windows and alert timing are covered in the last section, because they differ from the table above.
Which situations call for real time, and which do not?
Use this table to decide whether the live view is the right tool.
| Situation | What to watch | Window that fits | Caveat |
|---|---|---|---|
| Launch or release | Does the new page or tracking code send events at all? | The last 5 minutes | Confirms collection, not performance |
| Campaign going live | Is traffic arriving, and is it tagged with the UTM values you set? | The last 30 minutes | Too few visitors to judge conversion yet |
| Outage or broken page | Does the active count collapse compared with normal for this time of week? | Several 5-minute readings in a row | A drop can also be a holiday or a tracking failure |
| Social or press spike | Which page and source is the spike landing on? | The last 30 minutes | Spikes include bots unless they are filtered |
| Conversion rate, A/B decision, weekly review | Not real time | A finished day or more | Too noisy and not settled yet |
The last row is the one that matters most. The next section shows why.
| Situation | What to watch | Window that fits |
|---|---|---|
| Launch or release | Does the new page send events at all? | Last 5 minutes |
| Campaign going live | Traffic arriving with the right UTM values | Last 30 minutes |
| Outage or broken page | Active count against normal for this time of week | Several 5-minute readings |
| Social or press spike | Which page and source is it landing on? | Last 30 minutes |
| Conversion rate or A/B decision | Not real time | A finished day or more |
Rule of thumb: real time to detect and confirm, finished reports to judge.
Why is a real-time conversion rate misleading?
Because the sample is tiny and the same true rate looks very different at different sizes. Sample data: a site converts at a true 3.0%. Look at the 95% interval around the observed rate (the Wilson score interval, one of the intervals Brown, Cai and DasGupta recommend over the simple formula) at three window sizes:
| Window | Visitors | Conversions | Observed rate | 95% interval |
|---|---|---|---|---|
| Last 5 minutes | 120 | 3 | 2.5% | 0.9%–7.1% |
| One hour | 1,000 | 30 | 3.0% | 2.1%–4.3% |
| One day | 10,000 | 300 | 3.0% | 2.7%–3.4% |
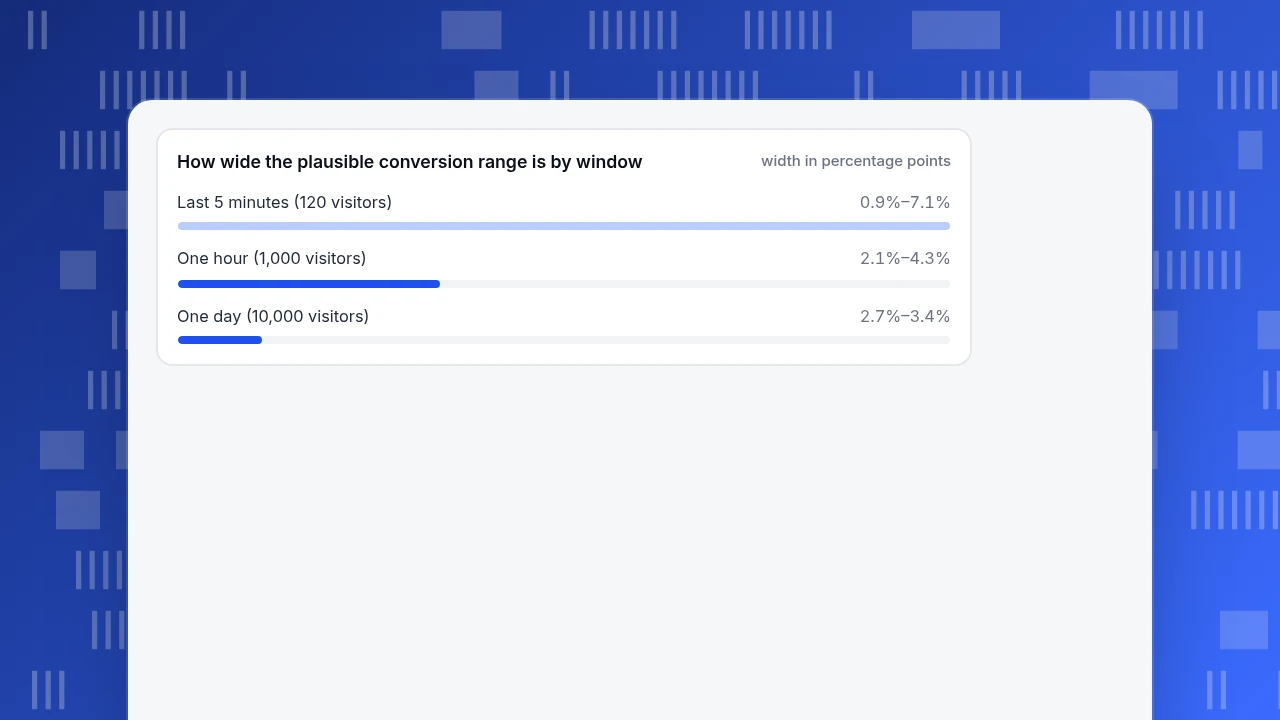
At 120 visitors, one more or one fewer sale moves the observed rate by about 0.8 points, and the range of plausible true rates runs from under 1% to over 7%, a spread of nearly eight times. At 10,000 visitors the range is 2.7% to 3.4%. Reading the five-minute figure as a trend would be reading noise.
Practical rule: before acting on a rate, check the interval. If the plausible range is wider than the change you are looking for, wait for a longer window.
How wide the plausible conversion range is by window
width in percentage pointsWorked example: detecting an outage with a simple rule
Sample data. A site's "online now" count (visitors with an event in the last 5 minutes) is read every 5 minutes. For Tuesday 14:00 over the last eight weeks, the readings were 172, 185, 190, 178, 181, 176, 184 and 179, so the median is 180. Set a rule: alert when two consecutive readings fall below 50% of that median, which is 90.
| Time | Online now | Below 90? |
|---|---|---|
| 14:00 | 176 | No |
| 14:05 | 171 | No |
| 14:10 | 88 | Yes (first) |
| 14:15 | 41 | Yes (second): alert |
| 14:20 | 12 | Yes |
The checkout broke at about 14:07, and the rule alerts at 14:15, so detection takes about 8 minutes. Two details make this work. The baseline uses the same weekday and time of day, so a normal quiet period does not trigger it. And requiring two readings in a row means one odd reading does not page anyone.
Compare it with a check that only runs on the hour: the next check would be at 15:00, which is 53 minutes after the break (15:00 − 14:07). That is the difference between a real-time view and an hourly alert, and it is why an outage plan should say which one it relies on.
What should a launch check include in the first 30 minutes?
A launch is the case where real time earns its keep, because every minute of broken tracking is data you cannot get back. A checklist with a time budget keeps it short:
- Minute 0–2: you are in the data. Open the page yourself in a clean browser window and look for your own pageview in the live feed. If it does not appear, stop and fix collection before anything else.
- Minute 2–5: key events fire. Click the buttons and submit the forms that matter once each, and look for those event names in the feed. A missing event is a tag problem, not a traffic problem.
- Minute 5–10: source tags survive. Open the page through a link with your UTM values and confirm the source and campaign show as you spelled them. A typo here splits a campaign into two rows for good.
- Minute 10–20: the first real visitors look normal. Compare the device and country mix with an ordinary day. A page that loads only for one browser shows up as a lopsided mix.
- Minute 20–30: write down the baseline. Note the active count and top pages, so the outage rule above has a reference for this new page.
Stop at 30 minutes. Everything past that, conversion, bounce and revenue, belongs to finished reports.
How do you use real-time analytics in TapCub?
TapCub has a live view and alerts, and they have different timing. Here is the launch-and-outage workflow from the examples above; the page-by-page reference is in view realtime visitors.

- After you ship a page or install the script, open it yourself, then go to Web analytics › Realtime. Within a few seconds your pageview should appear in the people feed. The page shows the number of distinct visitors with an event in the last 5 minutes and, beside it, the active pages and sources over the last half hour.
- For a campaign, check that your UTM sources appear in the half-hour source list. The feed can be filtered to pageviews, custom events, outbound clicks, downloads, forms and errors, and it separates people from bots. Recognised bots are not counted in the online number, so a crawler spike does not look like an audience.
- For a regional spike, open Monitoring › Globe and choose 1 hour, 6 hours, 24 hours or 7 days. It maps sessions by country, not precise locations.
- For outage detection, create a monitor in All-platform analytics › Operations › Monitors. The built-in measures include pageviews, visitors, sessions, error rate and error count, and one condition fires when no data has arrived for longer than a gap you set. Monitors check on an hour, day, week or month grain, so do not assume minute-level alerting. A dry run shows how many times the rule would have fired in the last 30 days. By default an alert is not repeated for about 60 minutes.
- Remember what it does not do: TapCub's alerts only notify you and do not take any action. Use finished reports such as Web analytics › Overview to judge conversion and performance after the data has settled.
FAQ
What is real-time web analytics?
It is a live view of current visitor activity: active users, the pages and sources they are on, and a feed of recent events, usually over a window of 5 to 30 minutes. It is meant for confirming and detecting, not for judging performance.
How real-time is real-time analytics?
Typically a few minutes. Google's documentation gives "a few minutes" for its Realtime layer and 2–6 hours for standard intraday data, with data possibly changing for 24–48 hours. Other tools differ, so check the freshness figure in your own tool's documentation.
When should I use real-time analytics?
At launches, when campaigns go live and when something may be broken. In each case you are asking whether something is happening right now. Do not use it for conversion rates, A/B decisions or weekly reviews.
Can I use real-time data to calculate conversion rate?
Only with care. At 120 visitors and 3 conversions the observed rate is 2.5%, but the 95% interval is 0.9% to 7.1%. Wait for a longer window, or check the interval, before treating a live rate as a trend.
Are real-time numbers exact?
No. They are provisional, can change as processing finishes and depend on a short window. Treat them as a signal to investigate, then confirm in settled reports.
Sources
- Google Analytics Help. Data freshness — realtime, intraday and daily processing times, and 24–48 hours. Checked 2026-11-20.
- Google Analytics Help. The Realtime report — 5-minute and 30-minute windows; app data batching. Checked 2026-11-20.
- Lawrence D. Brown, T. Tony Cai & Anirban DasGupta. Interval estimation for a binomial proportion. Statistical Science 16(2), 2001 — the Wilson interval and why the simple formula misbehaves.
Was this article helpful?
We use your answers to fix and expand this page.
Couldn’t send. Please try again in a minute.
Thanks for the feedback. We’ll use it to improve this page.You’ve already sent feedback on this page. Thanks.

Data Engineer
Writes about event design, data quality, and collection workflows, with verifiable implementation methods for reliable analytics.