Try it on your own data
Every report in this article is in the free plan. One snippet for web and apps, up to 10 sites.
Start freeReal-time customer engagement means responding to a customer's behavior within the window in which the response still matters. That window is seconds for a pricing-page chat invite, hours for a basket reminder and days for a win-back campaign. Add the delays of capture, processing, decision and delivery, and compare the total with the window; data delay directly shrinks who you reach.
What you will learn
- Real time is relative: compare event-to-action latency with how long the opportunity lasts
- In the sample, a 60-second data delay cut a 30-second chat-invite rule's reach from 47.5% to 23%
- Match the data path to the window: live data for invites and outages, daily refresh for win-back campaigns
What is real-time customer engagement?
Real-time customer engagement means acting on a customer's behavior while it still matters: a message, an offer or a human reply that arrives within the window in which the customer is still there to receive it. The test is not how fast your data is in the abstract. It is whether the time from the customer's action to your response is shorter than the time the opportunity lasts.
That makes "real time" relative. A visitor deciding whether to talk to someone about pricing may be gone in a minute. A shopper who left a basket may respond to an email hours later. A lapsed user is reached over days. Each of those is "real time" for its own situation, and each fails if the data arrives after the window closes.
What decides whether an engagement is fast enough?
Four steps sit between the customer's action and your response, and each adds delay:
- Capture. The event is recorded (a page view, a click, a cart change).
- Processing. The event is stored and made available to rules or reports.
- Decision. A rule, a person or a model decides what to do.
- Delivery. The message or reply reaches the customer.
Add the four delays and compare the total with the window. Two public figures help calibrate the extremes. Google's web.dev treats a page that responds to a tap or click within 200 milliseconds as having good responsiveness and anything above 500 milliseconds as poor, measured at the 75th percentile of real page loads, so interface feedback has to be sub-second. At the other end, Google Analytics documentation lists typical processing times for standard properties of a few minutes for its Realtime layer, 2–6 hours for intraday data and about 12 hours for daily data. A tool built on daily reports cannot support an engagement whose window is a minute, and it does not need to support one whose window is a week.
What does event-to-action latency look like for four examples?
The right way to use the table is column by column: trigger, action, window, then whether the data path fits. The windows are planning assumptions for this article, not measured industry figures, so replace them with your own.
| Example | Trigger event | Action | Window (planning assumption) | Typical data delay | Fits? |
|---|---|---|---|---|---|
| Pricing-page visitor | Stays on the pricing page for 30 seconds | Show a chat invite in an online agent's name | Under a minute, while the visitor is on the page | Seconds; the rule is evaluated on the server | Yes |
| Abandoned basket | Added to basket, no purchase | Send a reminder email | A few hours | Minutes if event-level; 12 or more hours if built on a daily report | Only with an event-level path |
| Error spike or outage | Error count or visitor count drops | Alert an engineer | 5–15 minutes | Seconds in a live view; an hour or more for a rule checked on an hourly grain | Only with a live view |
| Dormant user | No visit for 30 days | Win-back campaign | Days | Daily segment refresh | Yes |
For the basket row, Baymard's average of 50 published studies from 2006 to 2025 puts documented cart abandonment at 70.22%, with individual studies from 55% to 84%. On 10,000 sample baskets that is 7,022 abandoned. Knowing the volume is large explains why this case is worth building an event-level path for, but not that the window is short.
| Example | Trigger | Window (planning assumption) | Data path that fits |
|---|---|---|---|
| Pricing-page visitor | Stays 30 seconds on the pricing page | Under a minute | Server-side rule, seconds |
| Abandoned basket | Added to basket, no purchase | A few hours | Event-level, not a daily report |
| Error spike or outage | Errors up or visitors down | 5–15 minutes | Live view, not an hourly check |
| Dormant user | No visit for 30 days | Days | Daily segment refresh |
Windows are planning assumptions for this article; replace them with your own data.
Worked example: how data delay cuts the audience for a chat invite
Sample data. 1,000 visits reach the pricing page. Time on the page is distributed like this (assume visitors are spread evenly inside each band): 40% leave within 15 seconds, 25% stay 15–45 seconds, 20% stay 45–120 seconds and 15% stay longer than 120 seconds. A rule shows an invite once the visitor has stayed 30 seconds. How many see it?
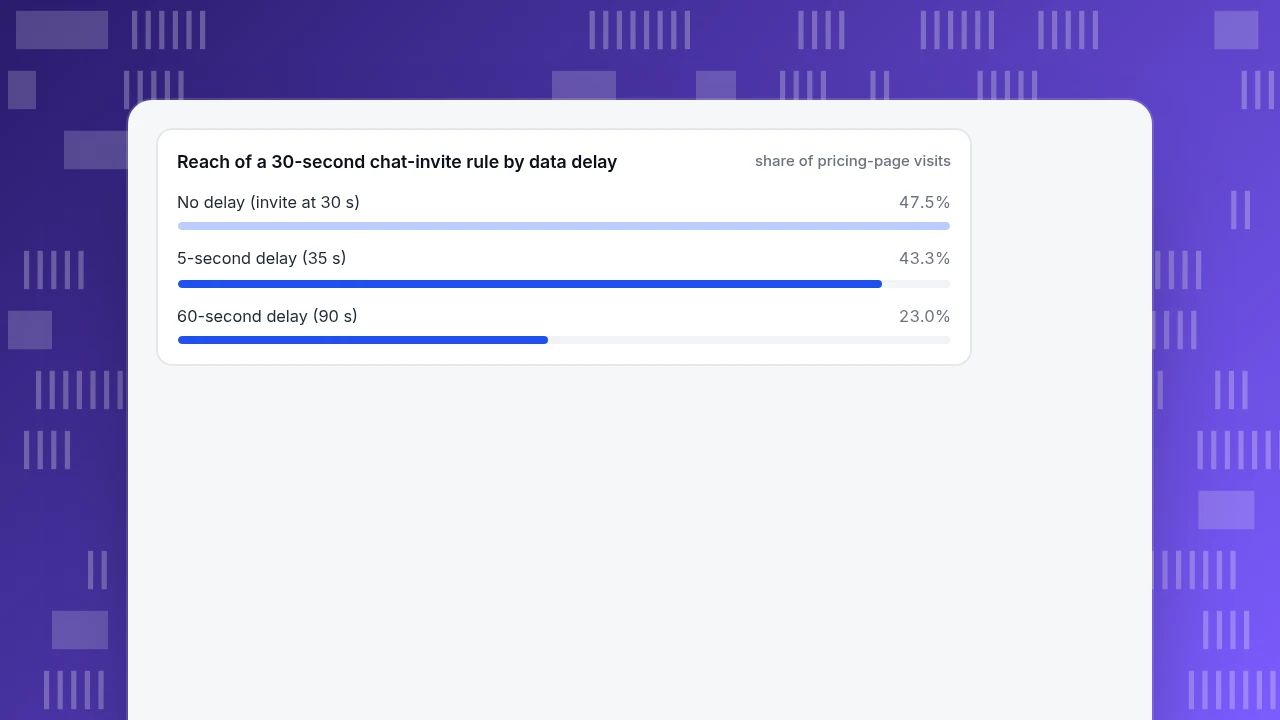
- Stay at least 30 seconds. The 15–45 second band loses its first half: 25% × (45 − 30) ÷ (45 − 15) = 12.5%. Add the two longer bands: 12.5% + 20% + 15% = 47.5%, or 475 visits.
- With a 5-second delay. The invite arrives at 35 seconds: 25% × (45 − 35) ÷ 30 = 8.3%, plus 35% = 43.3%, about 433 visits, a loss of 4.2 points.
- With a 60-second delay. The invite arrives at 90 seconds: 20% × (120 − 90) ÷ 75 = 8%, plus 15% = 23%, 230 visits.
- Result. A 60-second delay roughly halves the audience: 23% ÷ 47.5% = 48% of the original reach, even though the rule itself did not change.
Two lessons. First, delay is not a technical detail; it is the audience. Second, a shorter dwell time reaches more people but also more who were about to leave anyway: in the same distribution a 10-second rule reaches 73.3% of visits and a 120-second rule reaches 15%. Choose the dwell time by watching how many invites get opened and answered, not by the reach alone.
Reach of a 30-second chat-invite rule by data delay
share of pricing-page visitsHow do you write a latency budget for your own case?
Fill in one line per engagement before you build it:
- Window. How long does the opportunity last? Take it from your own data, for example the time-on-page distribution used above, not from a guess.
- Share you want to reach. Pick the share of the audience that must still be reachable, for example 40%.
- Latest acceptable arrival. Read it off the distribution: in the example, 40% reach is still possible when the invite arrives by 39 seconds (25% × (45 − 39) ÷ 30 = 5%, plus 35% = 40%).
- Subtract the fixed delays. If the rule waits 30 seconds, only 9 seconds are left for capture, processing and delivery together.
- Check each tool against that remainder. A tool that updates every hour fails a 9-second remainder, and passes a 3-hour one.
If a tool fails the budget, change the plan rather than the tool: widen the window, move the action to a slower channel such as email, or accept a smaller reach and write it down.
Which data does each engagement need?
The data needed follows the decision, not the other way round.
- Who is it? A stable visitor ID, so the second visit is recognised. After login, a user ID, so the person is the same across devices.
- What did they just do? The current page, the source they came from and the last few pages. This is what makes the message relevant, not generic.
- Have we already contacted them? A frequency cap, so no one is invited twice in one visit.
- Is anyone available to answer? Do not show a human-sounding invite when no agent is online, or hand off to a different path such as a leave-a-message form.
- How will we know it worked? Count opens and replies per rule, and compare conversion for visitors who engaged with those who did not, with the caution that people who chat were often closer to buying already. Proactive chat invites goes through that measurement.
For the layer underneath, which tools can capture and deliver at these speeds, see real-time analytics platforms.
What guardrails keep real-time engagement from becoming noise?
Speed makes mistakes expensive, so set limits before turning anything on.
- Cap frequency. One invite per visitor is a sensible default. Raise it only if the reply rate justifies it.
- Stay off critical steps. Do not interrupt a payment form.
- Match language and hours. An invite in the wrong language or outside working hours earns no replies and costs trust.
- Retire rules nobody answers. Review open and reply rates every week or two, and delete the lines that nobody opens.
- Keep a human path. If an automatic reply cannot resolve the question, hand it to a person.
How do you set this up in TapCub?
TapCub puts the visitor's analytics and the live conversation on one visitor ID, which keeps the capture, decision and delivery steps close together. Using the pricing-page example:
- In Live chat › Chat settings › Proactive invites, add a rule: match the pricing path, set the dwell time (3 to 600 seconds, we used 30) and write the invite text (up to 300 characters). Matching and frequency run on the server. By default each visitor is invited once.
- Check who is on the site now in Web analytics › Realtime: new pageviews appear within a few seconds, and from a live visitor row you can Start chat with a one-line message. You can start a chat with the same visitor only once per time they are online.
- When a visitor replies, the conversation arrives in Live chat › Inbox already showing their source, current page and their last 2 days of browsing, so the agent does not ask what they were looking at.
- After a week, open the rule list: it records impressions, open rate and reply rate per rule, so you can retire the ones nobody answers. For the effect on goals, use Live chat › Reports › Conversion attribution, which compares visitors who chatted with those who only browsed, and read the result as an upper bound for the selection-bias reason above.
- For outages, do not rely on alerts alone. All-platform analytics › Operations › Monitors check on an hour, day, week or month grain and only notify; use Web analytics › Realtime for the first minutes. TapCub does not send the abandoned-basket email, run offers or decide who gets them; it measures what happened before and after.
FAQ
What is real-time customer engagement?
Acting on a customer's behavior while the opportunity still exists: a message, offer or reply delivered within the window in which the customer is still there. The window can be seconds, hours or days, depending on the situation.
What is real-time customer engagement latency?
The total time from the customer's action to your response, made of capture, processing, decision and delivery. Compare it with how long the opportunity lasts. In the sample, a 60-second delay cut the audience of a 30-second invite rule from 47.5% to 23%.
Do I need real-time data for all customer engagement?
No. Match the data path to the window. A pricing-page invite needs seconds; a basket reminder hours; a win-back campaign days. A daily refresh is enough for the last and not for the first.
How do I measure whether real-time engagement works?
Track opens and replies per rule, then compare conversion for engaged and non-engaged visitors. Treat the raw gap as an upper bound, because visitors who engage are often closer to buying already.
What stops real-time engagement from annoying customers?
Frequency caps, staying off payment steps, matching language and working hours, and retiring rules that nobody opens. One invite per visitor is a sensible starting default.
Sources
- Baymard Institute. Cart abandonment rate statistics — average of 50 studies, 70.22%, range 55–84%. Checked 2026-11-20.
- web.dev. Interaction to Next Paint (INP) — good at or below 200 ms, poor above 500 ms, at the 75th percentile. Checked 2026-11-20.
- Google Analytics Help. Data freshness — typical delays for realtime, intraday and daily data. Checked 2026-11-20.
Was this article helpful?
We use your answers to fix and expand this page.
Couldn’t send. Please try again in a minute.
Thanks for the feedback. We’ll use it to improve this page.You’ve already sent feedback on this page. Thanks.

Product Adoption Consultant
Explores customer onboarding, live conversations, and self-service, turning common usage questions into practical guidance and improvements.