Try it on your own data
Every report in this article is in the free plan. One snippet for web and apps, up to 10 sites.
Start freeA real-time analytics platform collects events as they happen and lets you query them within seconds or minutes, instead of waiting for a batch job. Real time is not automatically better: it pays only when a decision changes within minutes of seeing the data. Below: the decision test, a break-even example, provisional numbers and vendor questions.
What you will learn
- Ask which decisions change within minutes before buying speed; many do not
- Streaming beats hourly refresh only when the hours saved per incident times cost per hour exceeds the extra monthly cost
- Fresh numbers are provisional: compare partial days with the same hours of other days
What is a real-time analytics platform?
A real-time analytics platform collects events as they happen, processes them continuously and lets you query the result within seconds or minutes, instead of waiting for a scheduled batch job. IBM describes real-time analytics as analysing data as it becomes available, using continuously updated streams, and contrasts it with batch processing that collects data over time and analyses it at set intervals.
Most platforms are built from the same parts: something that ingests events, something that processes them (filtering, joining, counting) and a store that can be queried quickly. "Real time" is not one speed. In practice there are three tiers:
| Tier | Typical delay | What it feels like |
|---|---|---|
| Streaming | Seconds to a few minutes | A live counter |
| Frequent batch | About an hour | A dashboard that refreshes through the day |
| Daily batch | Many hours | Yesterday's report in the morning |
For the underlying idea see realtime and data latency. The rest of this guide asks a different question: how fast do you need it to be, and what does that speed cost?
| Tier | Suits decisions like | Usually overkill for |
|---|---|---|
| Streaming (seconds to minutes) | Fraud blocking, outage response, launch checks | Weekly reporting, budget reviews |
| Hourly refresh | Operations dashboards, staffing, campaign pacing | Fraud blocking |
| Daily batch | Marketing performance, product reviews, finance | Anything where an hour of delay costs real money |
Match the tier to the slowest decision that still works, not the fastest one you can imagine.
Which decisions really need real-time data?
Speed has value only if someone can act on the information before it goes stale. Test each decision against "what would we do differently in the next ten minutes?"
| Decision | Delay that still works | Why |
|---|---|---|
| Block a suspicious payment | Seconds | The money moves immediately |
| Notice checkout is broken | Minutes to an hour | Every hour of outage costs orders |
| Confirm a launch or campaign went live | Minutes | You can fix a wrong link now |
| Staff a support queue for the next hour | About an hour | Staffing changes slowly |
| Move daily ad budget | A day | Platforms report on a lag anyway |
| Change pricing or roadmap | A week or more | A one-hour-old number does not alter the decision |
If a decision sits in the bottom half of that table, a daily refresh is not a compromise; it is the right fit. The common error is buying the speed of the top rows to inform the decisions in the bottom rows.
What does faster data cost, and when does it pay?
Break-even is simple: faster detection pays when (hours saved per incident × cost per hour × incidents per month) is larger than the extra monthly cost. Sample data: a store loses $1,500 of orders for every hour checkout is broken. Three set-ups, with assumed monthly platform costs and average time to notice a problem:
| Set-up | Platform cost per month | Average time to notice |
|---|---|---|
| Daily report | $400 | 12 hours |
| Hourly refresh | $1,100 | 1 hour |
| Streaming | $4,200 | 0.1 hour (6 minutes) |
Total monthly cost = platform cost + (incidents per month × hours to notice × $1,500):
| Incidents per month | Daily report | Hourly refresh | Streaming |
|---|---|---|---|
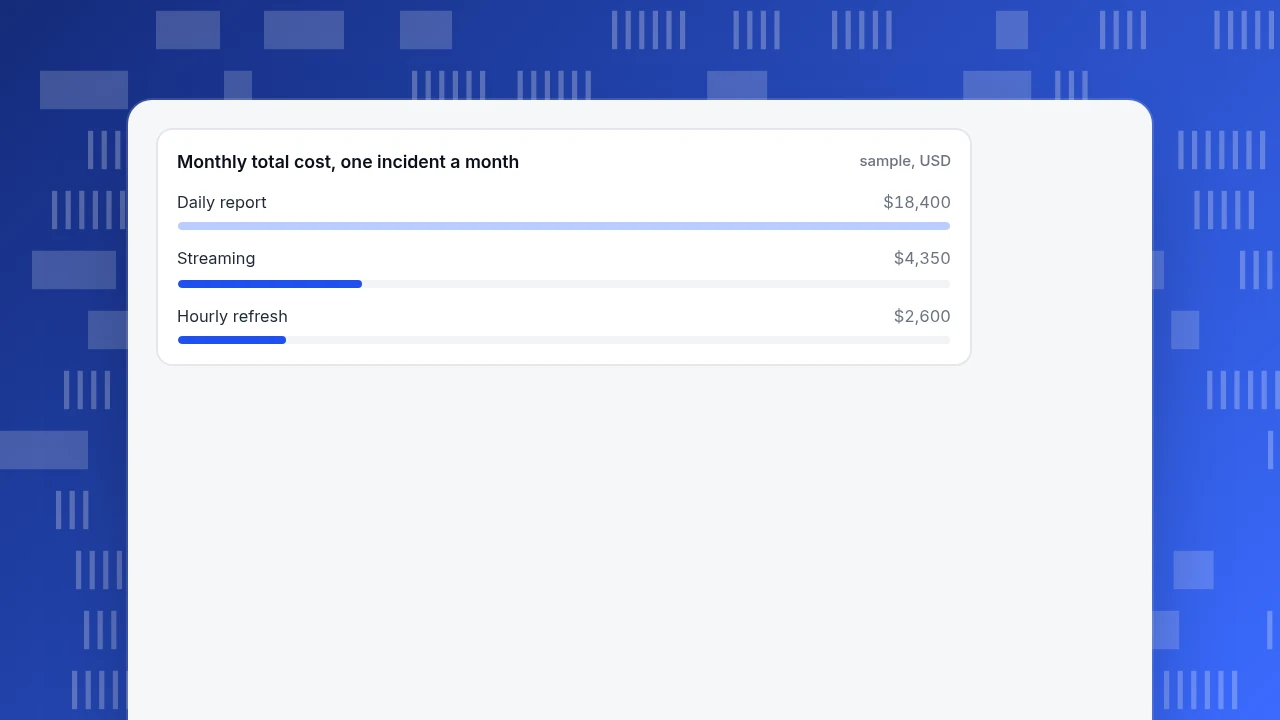
| 1 | 400 + 1 × 12 × 1,500 = $18,400 | 1,100 + 1 × 1 × 1,500 = $2,600 | 4,200 + 1 × 0.1 × 1,500 = $4,350 |
| 0.1 (one every ten months) | 400 + 0.1 × 12 × 1,500 = $2,200 | 1,100 + 0.1 × 1 × 1,500 = $1,250 | 4,200 + 0.1 × 0.1 × 1,500 = $4,215 |
The middle option wins in both cases. Streaming beats hourly only when the extra $3,100 a month is covered by the 0.9 hours it saves per incident: with one incident a month it needs an outage cost above 3,100 ÷ 0.9 ≈ $3,444 an hour. At $1,500 an hour it never pays. The numbers are invented, but the method is yours to reuse: put your own outage cost, incident rate and quotes into it.
Monthly total cost, one incident a month
sample, USDWhy do real-time numbers look different from the final numbers?
Fresh data is provisional. Events arrive late, get de-duplicated and are reclassified after the fact. One major analytics vendor documents this openly: its realtime view is typically a few minutes behind, its intraday data takes a few hours, and data processing can take 24 to 48 hours during which report data may change. Whatever tool you use, read its freshness page.
The practical rule: compare like with like. A partial day must be compared with the same hours of another day, never with a full day. Sample data: at 14:00 today you have 4,200 page views and yesterday's full day had 11,000. That looks like a 62% collapse. But yesterday had 4,500 views by 14:00, so the real change is 4,200 ÷ 4,500 − 1 = −6.7%. A monitor that compares to the full previous day would fire a false alarm every afternoon.
How do you apply this to your own team?
Run this short procedure before any demo:
- List the decisions. Write down every decision your team makes from data, who makes it and how often. Ten rows is typical.
- Write the tolerable delay for each. Ask "if this number were an hour old, would we decide differently?" A "no" moves the row to a slower tier.
- Price one bad hour. For an outage, take revenue per hour; for fraud, the average loss per undetected case; for a launch, the spend per hour of a broken campaign link.
- Count incidents. Use last year's real incidents, not a guess. If you had none, that is information too.
- Run the break-even from the cost section for each tier you could buy.
- Start one tier slower than you think. Hourly refresh is easy to speed up later; a streaming contract is harder to walk back.
Sample data: a team lists 10 decisions. Seven tolerate a day, two tolerate an hour (staffing and campaign pacing) and one, checkout health, tolerates minutes. That is a daily batch for most of the stack, with one small real-time or hourly alert for the one row that needs it, rather than a streaming platform for all ten.
What should you check when comparing platforms?
Marketing pages quote best-case latency. Ask for these specifics instead:
| Question | Why it matters |
|---|---|
| What is the delay from event to query result, at your peak volume? | Latency often grows with load |
| How are late and out-of-order events handled? | Determines whether numbers move after you read them |
| Can records be updated or deleted, or is it append-only? | Matters for corrections and privacy requests |
| Does it alert, or only display? | Nobody watches a screen all day |
| How does the price scale (events, queries, storage)? | A cheap pilot can become an expensive month |
| Can you export raw data? | Avoids lock-in and lets you audit totals |
| Who runs it: you or the vendor? | Streaming pipelines need people to operate them |
Weigh these against the decision table above rather than against each other's feature lists. A platform that is slightly slower but alerts you reliably usually beats a very fast one nobody is watching.
Which mistakes waste the most money?
- Buying speed for slow decisions. In the cost example, daily reports are cheapest per month but costly when outages are frequent; streaming is costly unless each hour is expensive.
- Reading a partial day as a full day. It produces false alarms and false panic.
- Confusing "live" with "correct". The first number is a sketch; the settled one is the record.
- Alerting on every wobble. A real-time metric moves; alert on thresholds that matter, with a quiet period between notifications.
- Ignoring who watches. If nobody is assigned to react, the speed is wasted.
- Treating latency as one number. Ask separately about ingest delay, processing delay and query delay.
How do you get real-time numbers in TapCub?
Take the launch and outage cases from the tables above. TapCub's real-time view is a ready-made report, not a streaming pipeline you build.
- Confirm the launch. Open Web analytics › Realtime. "Online now" counts visitors with an event in the last five minutes, and the page lists active pages and sources over the last half hour. After a release or campaign, visit your own page and the visit should appear in the human event stream within seconds.
- Watch what is happening. The event stream separates humans from bots and can be filtered to page views, custom events, outbound clicks, downloads, forms and errors, and paused while you read. Rows show time, page, source, country and device, never an IP address.
- Look closer. Click a visitor's details to open their latest session on the right and follow the path and events; new views appear within seconds while the session is still going.
- Turn "I should check" into an alert. In All-platform analytics › Operations › Monitors, create a check on a metric such as error rate or errors. Monitors check hourly, daily, weekly or monthly, so hourly is the fastest cadence. A test run calculates without sending and tells you how often it would have fired in the past 30 days. The same alert repeats at most about once an hour by default. Monitors only notify; they do not take action for you.
So for minute-level questions use Realtime, for "tell me if it breaks" use an hourly monitor, and for everything slower use the normal reports. TapCub does not offer a programmable stream-processing layer.
FAQ
What is a real-time analytics platform?
It is software that ingests events as they occur, processes them continuously and lets you query results within seconds or minutes, rather than waiting for a scheduled batch job. Typical components are ingestion, processing and a fast query store.
What is the difference between real-time and near real-time analytics?
Real-time usually means seconds to a few minutes; near real-time means a short, regular delay such as an hour. The honest question is whether your decision changes within that gap. If not, the slower tier is cheaper and just as useful.
Do I need real-time analytics?
Only if a decision can be changed within minutes by seeing the data: blocking fraud, spotting a broken checkout or confirming a launch. Pricing, roadmap and budget decisions rarely benefit. Use the decision table and break-even calculation above with your own numbers.
Is real-time data accurate?
It is provisional. Late events and de-duplication change totals after you first see them, and vendors document that final numbers can take a day or two. Compare partial periods with the same hours of other days, not with full days.
How much does real-time analytics cost?
It varies widely by volume and architecture, so use your own quotes. As a method, compare the extra monthly cost with hours saved per incident × cost per hour × incidents per month. In the sample, streaming only beat hourly refresh above about $3,444 of outage cost per hour.
See also: Real-Time Customer Engagement: Triggers, Data and Examples.
Sources
- IBM. What is real-time analytics?. Definition, batch versus streaming, example uses.
- Google. Data freshness, Google Analytics Help. Documented delays by data interval and the 24 to 48 hour processing note.
Was this article helpful?
We use your answers to fix and expand this page.
Couldn’t send. Please try again in a minute.
Thanks for the feedback. We’ll use it to improve this page.You’ve already sent feedback on this page. Thanks.

Data Analyst
Explores traffic sources, conversion funnels, and retention, using clear metric definitions and concrete examples to explain what the numbers mean.