Try it on your own data
Every report in this article is in the free plan. One snippet for web and apps, up to 10 sites.
Start freeGood quantitative research examples state three things: the question, the sample and the test. Without them a percentage is just an anecdote. Below: three published designs, a survey sample-size calculation (385 responses for ±5 points), a two-group test where the same 2-point gap gives p = 0.043 or p = 0.153, and a six-step design routine.
What you will learn
- An example is research only if it names a question, a defined group and a comparison
- A sample of 385 gives about ±5 points at 95% confidence; ±3 points needs 1,068
- The same 2-point gap is significant with 4,000 visitors (p = 0.043) and not with 2,000 (p = 0.153)
What is quantitative research?
Quantitative research answers a question with numbers: you measure something in a defined group, then use statistics to decide how far the result can be trusted. The question comes first (who, what, how much), then the sample, then the test. An example without those three parts, such as "we surveyed some customers and most liked it", is an anecdote with a percentage on it.
This guide shows what good examples look like, works two of them through with numbers you can recompute, and gives a six-step design routine. For the data itself see quantitative data; for when to add interviews and open answers see qualitative vs quantitative data.
What do real quantitative research examples look like?
Each design answers a different kind of question. The table pairs designs with a published or illustrative example.
| Design | Question it answers | Example |
|---|---|---|
| Randomised experiment | Did this cause that? | Oregon Health Insurance Experiment: in 2008 uninsured low-income adults were chosen by lottery to apply for Medicaid, so the lottery created the groups. A year later the lottery winners were about 25 percentage points more likely to have insurance |
| Quasi-experiment | What happened where a change hit, versus where it did not? | Card and Krueger compared 410 fast-food restaurants in New Jersey, where the minimum wage rose from $4.25 to $5.05 on 1 April 1992, with restaurants in Pennsylvania, where it stayed at $4.25, before and after the rise. Relative to Pennsylvania, New Jersey employment rose about 13% |
| Cohort study | What predicts an outcome over time? | Framingham Heart Study: from 1948 it followed 5,209 adults in Framingham, Massachusetts, with exams every two to six years, and linked smoking, cholesterol and blood pressure to heart disease |
| Survey | How common is something in a population? | A sampled customer survey: "What share use feature X weekly?" (worked below) |
| Web A/B test | Which version converts better? | Two page versions shown to random halves of visitors (worked below as a comparison) |
Notice what the three published examples share. Each states a question, a defined group and a comparison, and none relies on "people who chose it" as its comparison group. That is what makes them examples of research rather than reports.
Which design supports the strongest claim?
Match the claim to the design, from strongest to weakest evidence of cause:
| Design | Can it support "X caused Y"? | Main weakness |
|---|---|---|
| Randomised experiment | Yes, if assignment was random and the groups stayed intact | Cost, and people who drop out |
| Quasi-experiment | Sometimes, if the comparison group is credible | The groups may have differed before the change |
| Cohort study | Rarely; it shows association over time | Hidden third factors |
| Survey | No; it describes how common something is | Who replied, and how people interpret questions |
If you only have a survey, write "is associated with", not "causes". If you want the strong claim, plan for assignment from the start; it cannot be added after the data are collected.
How do you design a survey and size its sample?
Sample data: a software company has 20,000 customers and asks, "What share use feature X at least weekly?" It wants the answer within ±5 percentage points with 95% confidence.
The margin of error for a share is E = 1.96 × √(p × (1 − p) ÷ n). You do not know p before you ask, so use p = 0.5, which makes p × (1 − p) as large as possible (0.25) and gives the cautious sample size:
n = 1.96² × 0.25 ÷ 0.05² = 3.8416 × 0.25 ÷ 0.0025 = 384.16, rounded up to 385 responses.
Check: at n = 385 and p = 0.5, E = 1.96 × √(0.25 ÷ 385) = 0.0499, or about ±5 points. Tighter results cost much more: ±3 points needs 1.96² × 0.25 ÷ 0.03² = 1,067.1, so 1,068 responses, nearly three times as many.
Now response rate. Few people reply. If 25% of invited customers answer, 385 answers need 385 ÷ 0.25 = 1,540 invitations. The bigger risk is not the count but who replies: if keen users answer more often, the share using feature X is overstated and the formula's ±5 points does not cover that bias. Compare the respondents' mix (plan, tenure, region) with the customer base, or follow up with a sample of non-responders.
| Margin of error | Responses needed | Invitations at a 25% reply rate |
|---|---|---|
| ±10 points | 97 | 388 |
| ±5 points | 385 | 1,540 |
| ±3 points | 1,068 | 4,272 |
95% confidence, p = 0.5, simple random sampling; rounded up.
How do you compare two groups, and why does sample size decide the result?
Sample data: a page test shows version A to 2,000 randomly chosen visitors and version B to another 2,000. A converts 200 times (10.0%) and B converts 240 times (12.0%).
The question: could a 2-point gap appear by chance if the versions were really identical? Start from the null hypothesis, "no difference", and compute a two-proportion z-test:
- Pooled rate: (200 + 240) ÷ 4,000 = 11.0%.
- Standard error: √(0.11 × 0.89 × (1/2,000 + 1/2,000)) = 0.00989.
- z = (0.12 − 0.10) ÷ 0.00989 = 2.02.
- Two-sided p-value ≈ 0.043, below the usual 0.05 threshold.
- A 95% confidence interval for the difference (unpooled): 2.0 ± 1.96 × 0.989 points, from 0.06 to 3.94 points.
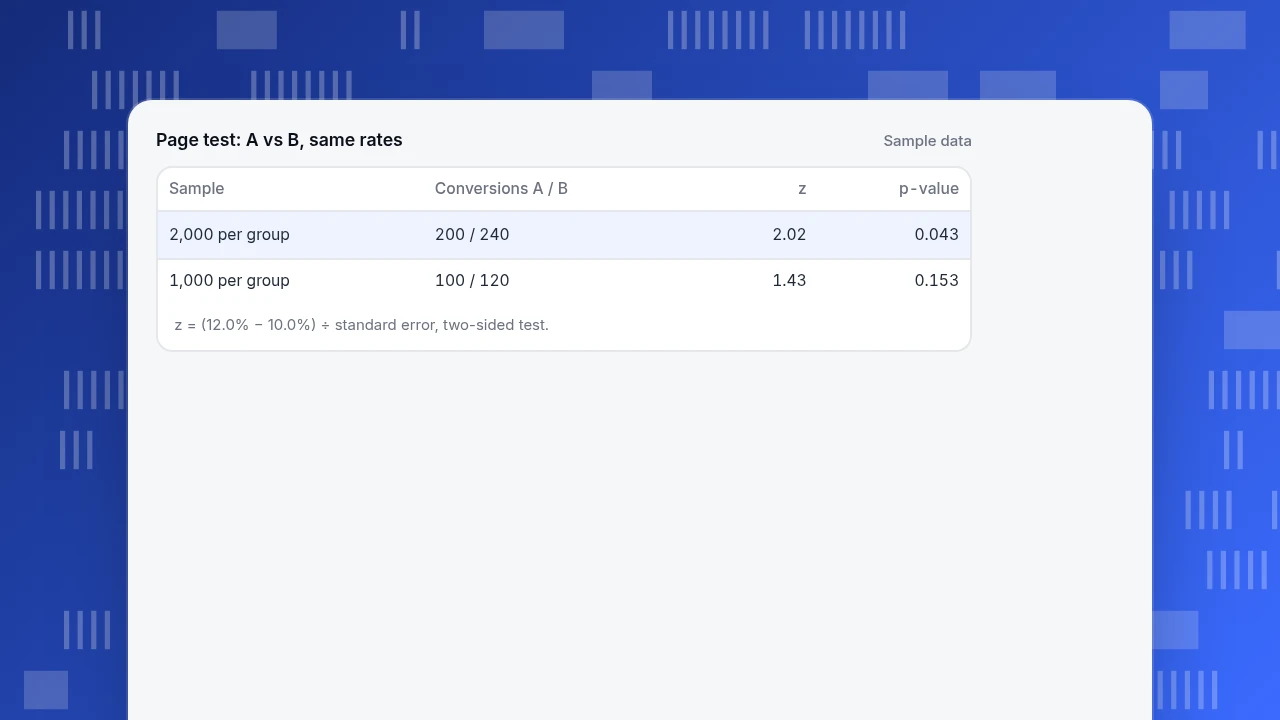
Now keep the same rates but halve the sample: 1,000 visitors each, 100 versus 120 conversions. The standard error rises to 0.0140, z falls to 1.43 and p rises to 0.153. Same observed gap, no evidence. The lesson is that "B beat A" depends on how many people you counted, and the interval, 0.06 to 3.94 points, is a more honest statement than "B is 2 points better". See hypothesis testing, p-value and statistical power for the concepts.
Page test: A vs B, same rates
Sample data| Sample | Conversions A / B | z | p-value |
|---|---|---|---|
| 2,000 per group | 200 / 240 | 2.02 | 0.043 |
| 1,000 per group | 100 / 120 | 1.43 | 0.153 |
z = (12.0% − 10.0%) ÷ standard error, two-sided test.
How do you design a quantitative study in six steps?
- Write the question so it can be answered with a number: "Does version B raise the share of visitors who start a trial?" rather than "Is B better?".
- Define the population and how you sample it. Who counts, and how will you reach a fair slice of them?
- Define each measure exactly. "Active" means what: one session, one event, seven days? Write it down before collecting.
- Choose the design from the examples table: experiment if you can assign people, comparison groups if you cannot, a survey if you need prevalence.
- Write the analysis plan first: the test, the threshold and the minimum sample. Choosing the test after seeing the data invites finding what you hoped for.
- List the threats and what you will do about each.
| Threat | What it looks like | What to do |
|---|---|---|
| Selection bias | People who chose the feature differ from those who did not | Randomise, or compare like with like; see selection bias |
| Non-response | Keen users answer; others stay silent | Raise the response rate, compare respondents with the base |
| Confounding | A third factor drives both the cause and the outcome | Control for it, or compare within segments |
| Too small a sample | A real gap looks like chance | Compute the sample size beforehand |
| Many tests, one winner | Test twenty things, one passes by luck | Decide the tests before, correct for the number run |
What mistakes weaken quantitative research?
- Reporting a percentage without the base. "60% agreed" means little without "of 12 respondents".
- Calling a correlation a cause. People who use a feature may simply be more engaged.
- Choosing the test after the data. Fix the analysis plan first.
- Treating p < 0.05 as proof. In the example, the same 2-point gap gave p = 0.043 with 4,000 visitors and 0.153 with 2,000.
- Ignoring who responded. The sample size formula covers chance, not bias.
- Stopping the moment a result looks good. Decide the sample size in advance.
How can you use TapCub's data in a quantitative study?
TapCub does not run significance tests, experiments or surveys. What it gives you is observational counts of behaviour, which suit a cohort-style question. Take: "Do visitors who use feature X in their first week come back more often?"
- Define the event precisely. Agree what counts as using feature X, and make sure it is tracked as an event, for example in All-platform analytics › Data › Tracking plan.
- Compare the two groups. In All-platform analytics › Behavior › Behavior analysis, use retention to see how many people in each group return in later periods, with the groups defined by whether they did the event.
- Check the group sizes. Small groups swing wildly; use the sample-size reasoning above before reading differences.
- Take the counts out for testing. Use All-platform analytics › Behavior › Metrics & SQL to query the numbers, or an export in All-platform analytics › Data › Data export, then run the test in a statistics tool.
- State the limit. People chose to use the feature, so the gap may reflect who they are, not what the feature did (selection bias). To establish cause you need to assign the feature at random; TapCub does not split traffic or run A/B tests.
FAQ
What are examples of quantitative research?
Randomised experiments such as the Oregon Health Insurance Experiment, quasi-experiments such as the Card and Krueger minimum wage study, cohort studies such as the Framingham Heart Study, sampled surveys and web A/B tests. All state a question, a defined group and a comparison.
What are the main types of quantitative research?
Experimental designs assign people to groups; quasi-experimental designs compare groups affected and unaffected by a change; observational designs such as cohort studies and surveys measure what exists. The more you control assignment, the stronger the claim about cause.
How big should the sample be?
It depends on the margin of error and confidence you want. For a share, n = 1.96² × 0.25 ÷ E²: 385 responses for ±5 points and 1,068 for ±3 points at 95% confidence. Divide by your expected response rate to get invitations.
Is a survey quantitative research?
Yes, when it uses fixed answer choices or numeric scales, a defined population and a sampling method, and reports counts or shares. A survey of open-ended answers is qualitative unless the answers are coded and counted.
What is the difference between quantitative and qualitative research?
Quantitative research measures how much or how many in a defined group and tests the result statistically; qualitative research explores why and how through interviews or observation. Many studies use both: numbers to find the pattern, conversations to explain it.
Sources
- Amy Finkelstein and others. The Oregon Health Insurance Experiment: Evidence from the First Year. NBER Working Paper 17190, 2011. Lottery design and about 25 points higher insurance coverage.
- David Card and Alan B. Krueger. Minimum Wages and Employment: A Case Study of the Fast Food Industry in New Jersey and Pennsylvania. NBER Working Paper 4509, 1993. 410 restaurants, before and after design.
- National Heart, Lung, and Blood Institute. Framingham Heart Study. Start in 1948, 5,209 participants, exams every two to six years.
- MacEwan University. Margin of Error and Sample Size Calculation for Proportion. The formulas and the p = 0.5 conservative choice.
Was this article helpful?
We use your answers to fix and expand this page.
Couldn’t send. Please try again in a minute.
Thanks for the feedback. We’ll use it to improve this page.You’ve already sent feedback on this page. Thanks.

Data Engineer
Writes about event design, data quality, and collection workflows, with verifiable implementation methods for reliable analytics.