Try it on your own data
Every report in this article is in the free plan. One snippet for web and apps, up to 10 sites.
Start freeA progress report is a short update on work that is still under way: where it stands against the plan, what changed, what is next and what you need from the reader. The writing rule is simple: conclusion and risk first, data second, so it can be read in a minute. This guide gives a five-block format, a worked example at week 8 of a 12-week project that forecasts a two-week slip and two fixes, and a table for the numbers.
What you will learn
- Open with a status colour and a one-line headline that names the cause and the request; put decisions above progress
- Compare every number with a target and the previous period: in the sample, signups grew 6.7% yet reached only 80.0% of target
- Forecast with simple arithmetic and say it assumes constant pace: 15 of 27 tasks done at week 8 means about week 14.4, and each fix is a number
What is a progress report?
A progress report is a short update on work that is still under way: where it stands against the plan, what changed since the last update, what happens next and what you need from the reader. It is written for someone who has to decide or stay informed, not for someone who needs the whole story. Three kinds are common: a student or research progress report (often graded), a project status report for a manager or client, and a results update for a marketing or analytics programme. This guide focuses on the last two, because the writing rule is the same: conclusion and risk first, data second, so the reader gets it in one minute.
The rule follows from how people read. Jakob Nielsen's explanation of the inverted pyramid notes that users do not read carefully online, scroll only when they expect payoff, and can stop at any point and still take away the main point if the most important information comes first. A progress report is read in the same hurried way, often on a phone between meetings.
What is the one-minute structure?
Five blocks, in this order, each with a size limit:
| Block | What it contains | Limit |
|---|---|---|
| 1. Status and headline | Green, amber or red, and one sentence saying why | 1 to 2 lines |
| 2. Decisions and risks | What you need from the reader, by when; risks with an owner and a date | 3 items |
| 3. Progress | Done, in progress, next, measured against the plan | 5 lines |
| 4. Numbers | Target, actual, difference, last period | 3 to 5 metrics |
| 5. Next period | What will be done before the next report | 3 bullets |
State what the colours mean in the first report and keep to it: for example, green is on plan, amber is a slip that you expect to recover with a decision or a change, red is a slip the reader must act on. If the status is amber or red, the headline says why and the decision block says what to do.
Put decisions above progress. A reader who stops after block 2 should already know what you need from them.
How to write the headline sentence: [Status]. [What is true now], [what it means for the date or the number], [what you need]. Compare:
| Weak headline | Stronger headline |
|---|---|
| "Good progress this month, a few challenges." | "Amber: signups are at 80% of target because conversion fell, not traffic; approve the checkout test by Friday." |
| "Work continues on the relaunch." | "Amber: relaunch is two weeks behind at the current pace; decide on scope or capacity by Friday." |
| "Campaign running as planned." | "Green: spend and signups both within 5% of plan; no decision needed." |
The weak versions are not wrong, but a reader cannot act on them. The stronger versions name the status, the cause, and the request, which is what block 2 then expands.
| Block | What it contains | Limit |
|---|---|---|
| 1. Status and headline | Green, amber or red, with one sentence on why | 1 to 2 lines |
| 2. Decisions and risks | What you need and by when; risks with owner and date | 3 items |
| 3. Progress | Done, in progress, next, against the plan | 5 lines |
| 4. Numbers | Target, actual, difference, last period | 3 to 5 metrics |
| 5. Next period | What will be done before the next report | 3 bullets |
Keep the same blocks every time so readers know where to look.
Worked example: a relaunch at week 8 of 12
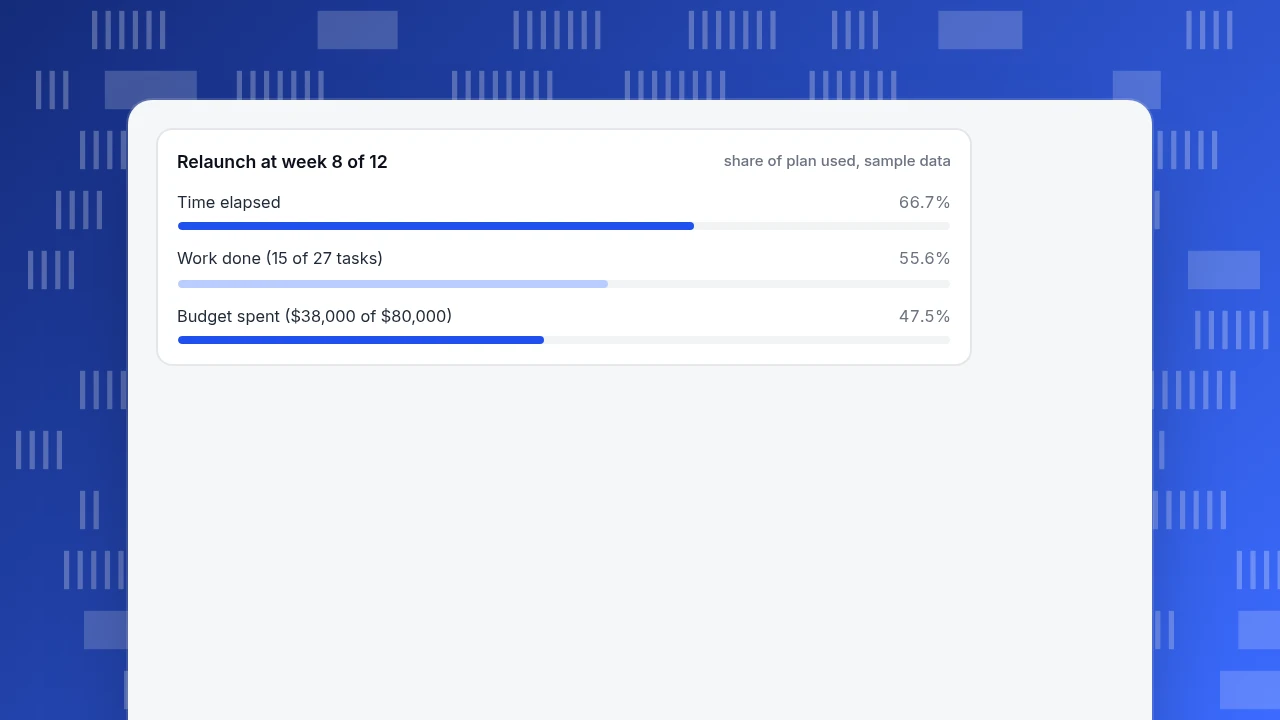
Sample data. A 12-week site relaunch has 27 tasks and an $80,000 budget. At the end of week 8: 15 tasks done, $38,000 spent.
| Question | Calculation | Result |
|---|---|---|
| How much time has passed? | 8 ÷ 12 | 66.7% |
| How much work is done? | 15 ÷ 27 | 55.6% |
| How much budget is used? | $38,000 ÷ $80,000 | 47.5% |
| What is the pace? | 15 tasks ÷ 8 weeks | 1.875 tasks per week |
| How long for the rest? | 12 remaining tasks ÷ 1.875 | 6.4 weeks |
| When does it finish at this pace? | 8 + 6.4 | Week 14.4 |
The work is behind the calendar (55.6% done against 66.7% of the time) while the budget is not (47.5% used for 55.6% of the work). A straight-line forecast says the project finishes 2.4 weeks late. That is a forecast, not a promise: it assumes the pace stays constant, and you should say so.
Two options fix it, and each is a number:
- Cut scope. Remove 5 of the 12 remaining tasks: 7 ÷ 1.875 = 3.7 weeks, finishing in week 11.7.
- Add capacity. Raise the pace to 3 tasks per week: 12 ÷ 3 = 4 weeks, finishing in week 12.0. The cost so far is $38,000 ÷ 15 = about $2,533 per task; the remaining 12 tasks at that rate cost about $30,400, for a projected total of $68,400, leaving roughly $11,600 of headroom to fund the extra capacity.
The report the reader receives is short:
Status: amber. At the current pace the relaunch finishes in week 14, two weeks late. Decision needed by Friday: cut 5 of the 12 remaining tasks, or fund extra capacity (about $11,600 of budget headroom). Progress: 15 of 27 tasks done (55.6%) at week 8 of 12 (66.7% of time); spend is $38,000 of $80,000 (47.5%), on plan. Risk: content sign-off is unscheduled; owner Dana, date to be set by Wednesday. Next week: finish the checkout pages and start redirects.
That is about 80 words, and the reader knows what is wrong, what to decide and what happens next.
Relaunch at week 8 of 12
share of plan used, sample dataWhat do you write in the numbers block?
Every metric needs four things: a target, an actual, the gap, and the previous period. Sample data for a marketing results update:
| Metric | Target | Actual | % of target | Last period |
|---|---|---|---|---|
| Visitors | 40,000 | 41,000 | 102.5% | 38,000 (+7.9%) |
| Signups | 600 | 480 | 80.0% | 450 (+6.7%) |
| Signup rate | 1.50% | 1.17% | 78.0% | 1.18% |
| Revenue | $60,000 | $48,000 | 80.0% | not reported |
Calculations: 41,000 ÷ 40,000 = 102.5%; 480 ÷ 600 = 80.0%; 480 ÷ 41,000 = 1.17% against a 1.50% target (1.17 ÷ 1.50 = 78.0%); last period's signup rate 450 ÷ 38,000 = 1.18%. Signups grew 6.7% on the last period (30 ÷ 450) yet reached only 80.0% of target, so the honest headline is "growing, but behind target," and the cause is visible in the table: visitors are on target, so the shortfall is conversion, not traffic.
Rules: no more than five metrics; the same definitions every time; say so when a number is missing rather than leaving it out; round to the precision the reader needs.
How long should a progress report be, and how often?
Match the format to the reader and the pace of change:
| Reader | Frequency | Length | Format |
|---|---|---|---|
| Your own team | Daily or twice weekly | 5 lines | Message or stand-up note |
| Manager | Weekly | One page | Email or doc using the five blocks |
| Client or sponsor | Every two weeks or monthly | One to two pages | The five blocks plus a short appendix |
| Course or funder | As instructed | As instructed | Follow their template |
Write the same blocks every time so readers learn where to look. Change the length by trimming detail, not by dropping blocks 1 and 2.
How does the structure change for a student or research progress report?
Course and funder templates ask for the same content in a different order, usually because the reader also grades or audits. Map the five blocks onto the usual headings, and follow the template you were given where it differs:
| Five blocks | Usual academic heading | What to write |
|---|---|---|
| Status and headline | Purpose and scope | What the project is and whether it is on schedule |
| Progress | Work completed | Tasks done, with evidence (data collected, chapters drafted) |
| Decisions and risks | Problems encountered | What blocked you and what you need from the reader |
| Next period | Work remaining and timeline | Tasks left, with dates against the deadline |
If a template asks for a Gantt chart or a schedule, the same arithmetic as the worked example (time elapsed against work done) shows whether the plan holds.
Which mistakes make progress reports hard to read?
- Starting with history. The reader does not need the story of the project; they need the status.
- Burying the decision. If you need an approval, put it in block 2.
- Reporting activity, not progress. "Held 12 meetings" is activity; "15 of 27 tasks done" is progress.
- No comparison. A number without a target and a previous period cannot be read.
- Changing definitions. If "done" changes meaning, the trend lies.
- Optimistic colour. Reporting green until the last week teaches readers to ignore the colour.
- Too many numbers. Beyond five, readers stop comparing.
How to produce the numbers block with TapCub
Suppose the marketing results update above. TapCub supplies the numbers, not the writing.
- Pull the actuals. Web analytics › Overview gives visitors and the headline numbers for the period; Web analytics › Goals gives goal conversions and the rate (the rate divides by unique visitors in the range).
- Compare with the last period. Use the date-range comparison on the same reports, so "last period" is computed the same way every time.
- Explain a gap. If signups are behind, Web analytics › Sources shows which channels fell short, and the funnel in All-platform analytics › Behavior › Behavior analysis shows which step lost people.
- Mark what changed. Add date annotations under Configuration › Annotations for launches and campaigns so the report can say what caused a movement.
- Automate the delivery. If your plan includes subscribed reports, Configuration › Settings › Notifications can send a daily, weekly or monthly report; for a stakeholder who only reads, Configuration › Settings › Public sharing creates a read-only link, with an optional password and a limit on how many days can be viewed.
TapCub does not write the status, the risks or the decision request; those are yours. See also web analytics report, automated reports and data storytelling.
FAQ
What is a progress report?
A short update on work still under way: status against the plan, what changed, what is next and what you need from the reader. Common forms are student or research reports, project status reports and marketing results updates.
What should a progress report include?
Five blocks: a status colour with a one-line headline, decisions and risks, progress against the plan, three to five metrics with target and last period, and the plan for the next period. Put decisions before progress.
How do you write a progress report?
Write the conclusion and the decision first, then the data. Compare every number with a target and the previous period. In the sample, 15 of 27 tasks done at week 8 of 12 produced an amber status and two options, each with a calculated outcome.
How long should a progress report be?
As short as the reader's attention allows: five lines for a team, one page for a manager, one to two pages for a client. Trim detail, not the status and decision blocks.
How often should you send a progress report?
Match the pace of change: daily or twice weekly for a team, weekly for a manager, every two weeks or monthly for a client or sponsor. Keep the same blocks each time so readers know where to look.
Sources
- Nielsen, J. Inverted Pyramid: Writing for Online. Nielsen Norman Group, 11 February 2018 — users do not read carefully online; starting with the most important information lets skimmers stop anywhere and still get the point. Read 2026-11-19.
- Nielsen, J. How Little Do Users Read?. Nielsen Norman Group — users read at most 28% and more realistically about 20% of the words on an average page. Read 2026-11-19.
Was this article helpful?
We use your answers to fix and expand this page.
Couldn’t send. Please try again in a minute.
Thanks for the feedback. We’ll use it to improve this page.You’ve already sent feedback on this page. Thanks.

Data Analyst
Explores traffic sources, conversion funnels, and retention, using clear metric definitions and concrete examples to explain what the numbers mean.