Try it on your own data
Every report in this article is in the free plan. One snippet for web and apps, up to 10 sites.
Start freeA product mix is the full range of products a company sells: all its product lines and the items within them. It has four dimensions: width (number of lines), length (total items), depth (versions within a line) and consistency (how closely lines relate). Judge each line by profit, not only revenue. Below: a worked four-line example.
What you will learn
- Describe a mix with four measures: width, length, depth and consistency
- Compare each line's share of items with its share of revenue and gross profit
- Trim the tail within a line before removing a whole line
What is a product mix?
A product mix is everything a company sells: all of its product lines and every item within them. A product line is a group of similar or complementary products, and a product item is one specific product. OpenStax's Principles of Marketing gives a pizza chain as its example: the mix includes pizza, salads, sandwiches, appetizers, pasta, desserts and beverages, which is seven lines, and the pizza line holds five products.
The reason to care is that a mix is a set of choices about where to spend money, shelf space and attention. Two businesses with the same revenue can have very different mixes, and the right changes depend on which lines carry the profit. This guide explains the four dimensions used to describe a mix, works through one example with real arithmetic and shows how to decide whether to widen, deepen, trim or tighten it. For how a mix fits into a wider plan see product strategy framework.
The four dimensions of a product mix
Textbooks describe a mix with four measures. The table shows each one, how to count it and a question it should make you ask.
| Dimension | What it measures | How to count it | Question to ask |
|---|---|---|---|
| Width | How many product lines you sell | Number of lines | Does each line earn its place? |
| Length | How many items you sell in total | Items across all lines | Which items carry the weight, and which are tail? |
| Depth | How many versions sit inside one line | Items in that line | Are there variants customers never choose? |
| Consistency | How closely the lines relate in use, production and distribution | Judgement, checked against shared customers and suppliers | Do the lines sell to the same people through the same channels? |
Two points are easy to get wrong. Width counts lines, not items: adding a new flavour to an existing line increases depth and length but not width. And consistency is the only dimension that is not a count; test it with data (do customers of one line buy from the others?) rather than opinion.
Product mix, product line and product item: how the terms differ
People use these words loosely, which causes confusion when a team compares numbers. Keep them apart:
- Product item. One specific product, such as a 250 g bag of a single-origin coffee. It is the unit you count for length.
- Product line. A group of similar or complementary items, such as all coffee beans. It is the unit you count for width, and the unit within which you count depth.
- Product mix. All the lines together. Some writers call it the assortment or the portfolio; the label matters less than agreeing on which of the three levels a number refers to.
When someone says "we have 40 products", ask whether they mean 40 items, 40 lines or 40 variants, because the answer changes which dimension has moved. A shop that adds ten colours of one mug has grown in length by ten and in depth by ten, and in width by nothing.
Worked example: a four-line shop
Sample data: an online shop sells coffee, tea, equipment and accessories. Last month's figures:
| Line | Items | Revenue | Gross margin | Gross profit |
|---|---|---|---|---|
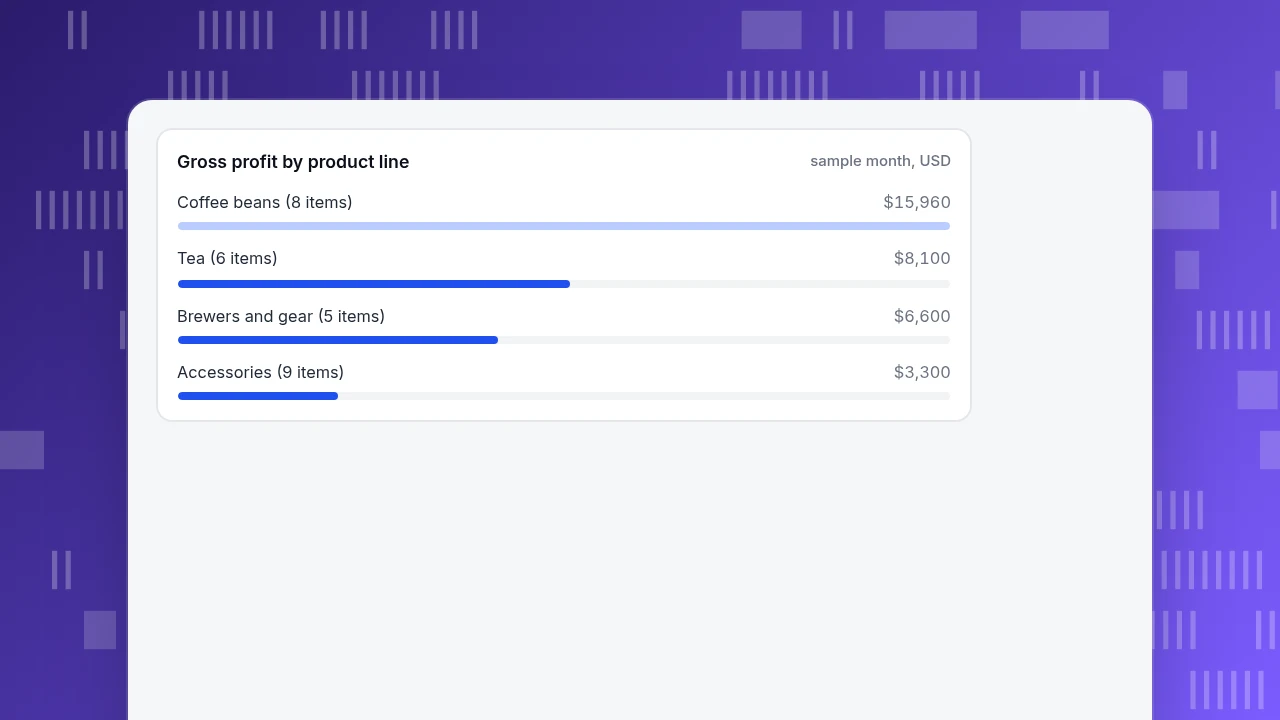
| Coffee beans | 8 | $42,000 | 38% | $15,960 |
| Tea | 6 | $18,000 | 45% | $8,100 |
| Brewers and gear | 5 | $30,000 | 22% | $6,600 |
| Accessories | 9 | $6,000 | 55% | $3,300 |
| Total | 28 | $96,000 | 35.4% | $33,960 |
Gross profit is revenue × margin, so coffee is $42,000 × 38% = $15,960 and the total margin is $33,960 ÷ $96,000 = 35.4%.
The four dimensions. Width is 4 lines. Length is 8 + 6 + 5 + 9 = 28 items. Average depth is 28 ÷ 4 = 7 items per line, ranging from 5 to 9. In this sample, coffee, tea and gear are bought by the same home brewers, so consistency is high; accessories fit less clearly.
What the numbers say. Compare each line's share of items, revenue and gross profit:
| Line | Share of items | Share of revenue | Share of gross profit |
|---|---|---|---|
| Coffee beans | 28.6% | 43.8% | 47.0% |
| Tea | 21.4% | 18.8% | 23.9% |
| Brewers and gear | 17.9% | 31.3% | 19.4% |
| Accessories | 32.1% | 6.3% | 9.7% |
Accessories is the deepest line: 9 of the 28 items (32.1%), but only 6.3% of revenue and 9.7% of gross profit. Revenue per item is $6,000 ÷ 9 = $667, against $5,250 for a coffee item. Equipment brings in 31.3% of revenue but only 19.4% of gross profit, because its margin is the lowest at 22%. A revenue ranking would call equipment the second-best line; a gross profit ranking puts it third, behind tea.
A trimming decision. Suppose the five weakest accessories together make 5% of that line's revenue: $6,000 × 5% = $300, or $300 × 55% = $165 in gross profit. If each item costs $120 a month in stock, handling and listing upkeep (an assumption to replace with your own), five items cost $600. Dropping them changes monthly profit by $600 − $165 = +$435, and the line's depth falls from 9 to 4. The line stays; the tail goes. That is a depth decision, not a width decision. The same 80-20 logic is in Pareto analysis.
Gross profit by product line
sample month, USDHow to evaluate a product mix
Work through the dimensions in order and write the answer as a number.
- Width: does each line pass a profit test? Rank lines by gross profit, not only revenue, and compare with their share of items. A line with a large share of items and a small share of profit, like accessories, is a candidate for trimming, not removal.
- Length: where is the tail? List items by revenue and find how many make up the first 80%. Items below that point need a reason to stay: they complete a set, attract new customers, or are strategic.
- Depth: which variants never sell? Within a line, a variant that sells fewer than a few units a month adds stock cost and choice overload with no revenue.
- Consistency: do customers cross lines? Check how many buyers of one line also buy another. If buyers of tea rarely buy equipment, they are separate businesses with separate marketing.
- Trend: what moved? Compare this period's shares with last period's, and check for returns, which reduce a line's real profit.
Do this at least quarterly, and every time you add a line, because each new line changes what the others contribute. A mix reviewed once a year drifts.
Four moves, and the signal for each
- Widen (add a line). Signal: customers ask for adjacent products and existing lines are saturated. Check consistency first: a new line that sells to different people through different channels is a new business.
- Deepen (add items to a line). Signal: the line has high revenue per item and customers seek variants. Check that new items add revenue, not just split the old.
- Trim (remove items). Signal: a tail whose profit does not cover its cost, as in the example. Trim items before lines.
- Tighten (raise consistency). Signal: lines that do not share customers or channels. Concentrate on the lines whose buyers overlap.
| Move | Signal to look for | Check before doing it |
|---|---|---|
| Widen (add a line) | Customers ask for adjacent products; current lines are saturated | Will the new line sell to the same people through the same channels? |
| Deepen (add items) | High revenue per item; customers seek variants | Do new items add revenue or only split the old? |
| Trim (remove items) | A tail whose profit does not cover its cost | Does the item complete a set or attract new customers? |
| Tighten (raise consistency) | Lines with no shared customers or channels | Which lines have overlapping buyers? |
Review the shares every quarter and whenever a line is added.
Common mistakes with product mix
- Judging lines by revenue alone. Equipment ranked second by revenue and third by profit.
- Counting width as items. Width counts lines. A new variant raises depth.
- Cutting a whole line to fix a tail. In the example, accessories has a high margin; the problem is five items.
- Adding lines that do not fit. A new line with no shared customers or channels competes for attention.
- Treating the mix as fixed. Costs, seasons and demand move; review the shares each quarter.
- Ignoring returns. A line with many returns earns less than its gross profit says.
In TapCub: read revenue by item, category and brand
Take the shop above. TapCub measures the revenue side of the mix; it does not know your costs, so margins stay in your own spreadsheet.
- Send purchases from the server. On payment success, send a
purchaseevent with an order id, amount and currency, and put the line items in anitemsarray so item, category and brand can be ranked. Send arefundwith the same order id when needed. - Open the revenue page. All-platform analytics › Business › Commerce & revenue shows revenue, orders, buyers and average order, with item, category and brand ranks built from your line items. If categories mirror your product lines, the category rank is your revenue-by-line table.
- Check what customers do before buying. The purchase funnel (view item, add to cart, checkout, purchase) is per session. Refunds are reported separately and are not subtracted from revenue, so read them next to the line.
- Check repeat buying. The same page reports repeat rate (people with two or more purchases ÷ buyers), which helps judge whether a line brings people back.
- Join it with your costs. Copy the revenue ranks into your spreadsheet, apply margins and compute gross profit and revenue per item.
TapCub does not manage inventory or costs, and it does not tell you which products to add; it shows how revenue and customers move across the lines you already have. See ecommerce analytics for the wider set of shop metrics.
FAQ
What is a product mix?
A product mix is the full range of products a company sells: all of its product lines and the items inside them. It is also called a product assortment or portfolio. It is described by four measures: width (number of lines), length (total items), depth (versions within a line) and consistency (how closely the lines relate).
What are the four dimensions of a product mix?
Width is the number of product lines. Length is the total number of items across all lines. Depth is the number of versions within one line. Consistency is how closely related the lines are in use, production and distribution. Only consistency is a judgement; the other three are counts.
What is an example of a product mix?
A shop with four lines (coffee beans, tea, brewers and gear, accessories) and 28 items has a width of 4, a length of 28 and an average depth of 7. In the sample above, accessories held 32.1% of items but 9.7% of gross profit, which points to a depth decision.
How do you improve a product mix?
Rank lines and items by gross profit as well as revenue, find the tail that does not cover its cost and trim items before lines. Check that new lines share customers and channels with existing ones. Review the shares each quarter.
Sources
- OpenStax. Product Items, Product Lines, and Product Mixes. Principles of Marketing — definitions of product item, line, mix, width (number of lines) and depth (products in a line), with a seven-line example. Checked 2026-11-19.
- Corporate Finance Institute. Product Mix — the four dimensions: width, length, depth and consistency. Checked 2026-11-19.
Was this article helpful?
We use your answers to fix and expand this page.
Couldn’t send. Please try again in a minute.
Thanks for the feedback. We’ll use it to improve this page.You’ve already sent feedback on this page. Thanks.

Product Analyst
Focuses on event analysis, conversion funnels, and retention, using clear metric definitions and structured analysis to explain product performance.