Try it on your own data
Every report in this article is in the free plan. One snippet for web and apps, up to 10 sites.
Start freeA product-led growth strategy lets the product acquire, convert and expand customers: people start without a sales call, reach value on their own, and a person steps in only when usage shows they are likely to pay. It comes down to five decisions, each measured by one number. Below: choosing activation, testing a product-qualified lead and judging fit.
What you will learn
- Define five decisions (entry, value, habit, spread, handoff) and give each one number
- Choose activation by comparing candidate actions against retention, weighing reach as well as gap
- Test the product-qualified rule against paid conversion and re-check it every quarter
What is a product-led growth strategy?
A product-led growth (PLG) strategy is a plan for letting the product itself do most of the work of acquiring, converting and expanding customers: people start using it before anyone talks to them, and they pay because of what they experienced. Two public filings show the idea in practice. Dropbox's S-1 describes viral, bottom-up adoption in which registered users act as the salespeople, and Atlassian's annual report describes winning customers through word of mouth, online marketing and free trials rather than a direct sales force.
A strategy is not a pricing page with a free plan. It is a set of choices about who can start without help, what they need to experience before they pay, and when a person should step in. The rest of this guide turns that into five decisions, shows how to pick the numbers that measure them, and works one example through. For the definition itself see product-led growth; for the full list of metrics see product-led growth metrics. This guide stays on the strategy: what to decide and how to check it with data.
The five decisions of a PLG strategy
Each decision has a question and one number that tells you whether it is working.
| Decision | Question | The number to watch |
|---|---|---|
| Entry | Who can start with no sales call, and how? | Visitor-to-sign-up rate |
| Value | What must a new user do to get the point of the product? | Activation rate (share doing the key action in a set window) |
| Habit | Do they come back? | Retention at day 7 / day 30 |
| Spread | Does use bring in other users or teammates? | Invites sent per activated user |
| Handoff | When should a person contact them? | Paid conversion of the product-qualified group vs everyone else |
Most weak PLG strategies skip a row. A free plan with no activation definition cannot tell whether it works. A sales team with no handoff rule contacts everyone, or no one. The sections that follow take the three rows that need the most care: value, handoff and fit.
Choose the activation event with data, not opinion
Activation is the point at which a new user has experienced the value you promised. The common mistake is to pick it from a meeting. A better way is to list candidate actions and compare what happens to the people who did each one in their first week.
Sample data: 800 people signed up in a month, and 168 of them (21.0%) were still active at day 30. For three candidate actions done within seven days of sign-up:
| Candidate action | Did it | Day-30 retention if they did | Day-30 retention if they did not | Gap |
|---|---|---|---|---|
| Created a report | 320 (40.0%) | 120 ÷ 320 = 37.5% | 48 ÷ 480 = 10.0% | 27.5 points |
| Invited a teammate | 200 (25.0%) | 102 ÷ 200 = 51.0% | 66 ÷ 600 = 11.0% | 40.0 points |
| Connected a data source | 480 (60.0%) | 144 ÷ 480 = 30.0% | 24 ÷ 320 = 7.5% | 22.5 points |
Reading it:
- Reach matters as much as the gap. Inviting a teammate has the biggest gap, but only 25% of sign-ups do it. As the activation event it would label 75% of people as failures. Creating a report reaches 40% and still separates well.
- It is a correlation. People who invite a teammate may already be the keen ones. Use the table to shortlist candidates, then test whether prompting the action moves retention.
- Choose one event and one window. Here: "created a report within seven days". Write it down, so the rate can be compared month to month.
Use the strongest-gap action that is not too rare as the activation event, and keep the rarer, stronger signals for the handoff in the next section.
Define the product-qualified lead for the handoff
A product-qualified lead (PQL) is a user or account whose usage shows they are likely to pay, so a person should reach out. The usual error is to define it from a feature list and never check it. Define it in three steps: pick the behaviour (the action with the strongest link to paying), set a threshold, and test it against paid conversion.
For this product, the sample rule is: activated, and at least three people from the same team active within 14 days. That qualifies 48 of the 320 activated users, 15.0%. See product-qualified lead for the definition.
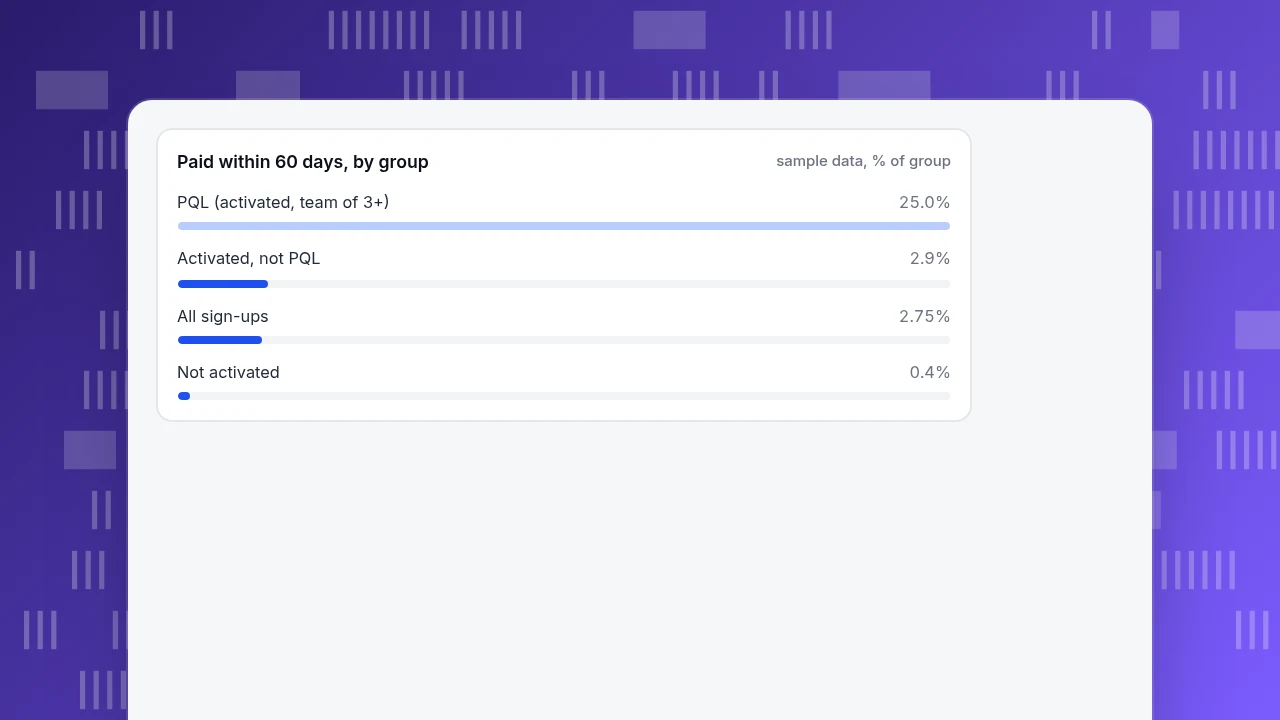
Then check the rule against what happened in the following 60 days:
| Group | People | Paid within 60 days | Paid rate |
|---|---|---|---|
| PQL (activated, team of three or more) | 48 | 12 | 25.0% |
| Activated, not PQL | 272 | 8 | 2.9% |
| Not activated | 480 | 2 | 0.4% |
| All sign-ups | 800 | 22 | 2.75% |
The PQL group is 6.0% of sign-ups (48 ÷ 800) and produces 54.5% of the payers (12 ÷ 22). Its paid rate is 25.0% ÷ 2.9% = 8.5 times that of the other activated users. A salesperson who contacts the 48 PQLs closes about 0.25 payers per contact (12 ÷ 48); one who contacts all 320 activated users gets 20 ÷ 320 = 0.0625.
Two cautions. Some PQLs would have paid without a call, so the table shows who is likely to pay, not what a call adds; compare contacted and uncontacted PQLs to learn that. And revisit the rule every quarter, since it describes last quarter's users.
Paid within 60 days, by group
sample data, % of groupWorked example: one month of a PLG funnel
Sample data, all from the tables above: 10,000 visitors reach the site in the month.
- Entry: 800 sign up, a rate of 800 ÷ 10,000 = 8.0%.
- Value: 320 create a report within seven days, an activation rate of 320 ÷ 800 = 40.0%.
- Handoff: 48 meet the PQL rule, 48 ÷ 320 = 15.0% of the activated.
- Paying: 22 of the 800 pay within 60 days, 22 ÷ 800 = 2.75%, or 22 ÷ 10,000 = 0.22% of visitors.
Where to put effort follows from the numbers. Raising the entry rate from 8.0% to 9.0% adds 100 sign-ups, which at the 2.75% paid rate is 2.75 more payers. Raising activation from 40.0% to 45.0% moves 40 people from the 0.4% group to the 2.9% group, which is 40 × (2.9% − 0.4%) = about 1.0 more payer, and it puts more people on the path to the 25.0% group. The arithmetic says which lever is cheapest to move. It does not say which is possible; that comes from watching where people stall.
| Stage | Formula | Sample result |
|---|---|---|
| Sign-up rate | Sign-ups ÷ visitors | 800 ÷ 10,000 = 8.0% |
| Activation rate | Activated ÷ sign-ups | 320 ÷ 800 = 40.0% |
| Product-qualified share | PQLs ÷ activated | 48 ÷ 320 = 15.0% |
| Paid rate | Payers within 60 days ÷ sign-ups | 22 ÷ 800 = 2.75% |
Split the paid rate by group: PQL 25.0%, activated non-PQL 2.9%, not activated 0.4%.
When a PLG strategy is a poor fit
PLG assumes people can try the product alone and reach value quickly. It fits badly when:
- Value needs setup nobody can do alone. If a first result needs data integration by a specialist, a self-serve trial ends before value begins.
- The buyer is not the user. If the person who feels the pain cannot approve a purchase, the PQL has nobody to hand off to.
- Purchases are rare and large. A product bought once every few years gives little usage to qualify against.
- The market is regulated. Where a purchase needs review by procurement or compliance, a person must be in the loop from the start.
In those cases keep the product-led parts that still apply (a clear demo, usage evidence for the buyer) and let sales lead.
Common mistakes in a PLG strategy
- Counting sign-ups as growth. A sign-up without activation is a cost. Report activation next to it.
- Choosing activation by opinion. Compare candidate actions against retention, as in the table above.
- Hand-offs by feature use. "Used the export feature" does not mean ready to buy. Test every rule against paid conversion.
- Treating a PQL as a score. A PQL is a rule you can audit, not a number from a model nobody can explain.
- Measuring only the average. Overall conversion hid a 25.0% group and a 0.4% group. Always split by the behaviour you care about.
- Forgetting the people who are not users. For team products, count accounts, not just individuals.
In TapCub: measure activation and the PQL group
Take the example above. TapCub can measure each step and stops where a person or a CRM would take over.
- Send the actions as events and identify people. Send events such as sign-up, report created and teammate invited, and call
tapcub.loginwhen users sign in so the person has a profile in All-platform analytics › Users › People. Anonymous visitors have no profile and will not appear in segments. - Find the activation event. In All-platform analytics › Behavior › Behavior analysis, use retention with the sign-up event as the start event and compare the people who did each candidate action in their first week with those who did not.
- Define the PQL as a segment. In All-platform analytics › Users › Segments & tags, build a rule segment ("did report created" and "did teammate invited", with a date window). It refreshes daily or on demand, can be carried into funnels and retention, and keeps a 30-day history of its size.
- Group by team. If you use
tapcub.group('company', ...), All-platform analytics › Users › Accounts lists accounts, their active members and a 0–100 health score. It is an organisation view: it cannot open individual details or add segments to an analysis. - Alert on the number. Save the activation count as a custom metric in All-platform analytics › Behavior › Metrics & SQL, then set a monitor on it in All-platform analytics › Operations › Monitors; the monitor only notifies.
TapCub does not score leads, send them to a CRM or contact them, and it does not run experiments, so the contacted-versus-not-contacted test needs your own process. See product-led growth metrics for the wider metric list.
FAQ
What is a product-led growth strategy?
It is a plan that lets the product drive acquisition, conversion and expansion: people start without a sales call, reach value on their own, and a person steps in only when usage shows they are likely to pay. It is defined by decisions on entry, value, habit, spread and handoff, not by having a free plan.
What are the key elements of a PLG strategy?
Self-serve entry, a defined activation event, retention, a way for use to spread to teammates, and a rule for when sales steps in. Each needs one number: sign-up rate, activation rate, day-30 retention, invites per activated user and the paid rate of the product-qualified group.
How do you measure product-led growth?
Track the funnel from visitor to sign-up, activation, product-qualified lead and paid, and split conversion by behaviour. In the sample above, overall conversion was 2.75% while the product-qualified group converted at 25.0% and non-activated sign-ups at 0.4%. Averages hide that spread.
Is PLG the same as freemium?
No. Freemium and free trials are ways to let people start; PLG is the whole strategy around them, including how people reach value, how use spreads and when sales gets involved. A free plan with no activation definition and no handoff rule is not a strategy.
See also: SaaS Product Marketing: Turn Features Into Outcomes and Test by Activation.
See also: Product Thinking: How to Frame a Feature Request as an Outcome.
Sources
- Dropbox, Inc. Form S-1 registration statement. U.S. Securities and Exchange Commission, 2018 — the Prospectus Summary section on viral, bottom-up adoption. Checked 2026-11-19.
- Atlassian Corporation Plc. Form 20-F for fiscal year 2018. U.S. Securities and Exchange Commission — Item 3.D risk factor on its marketing model: word of mouth, online marketing and free trials. Checked 2026-11-19.
Was this article helpful?
We use your answers to fix and expand this page.
Couldn’t send. Please try again in a minute.
Thanks for the feedback. We’ll use it to improve this page.You’ve already sent feedback on this page. Thanks.

Product Analyst
Focuses on event analysis, conversion funnels, and retention, using clear metric definitions and structured analysis to explain product performance.