Try it on your own data
Every report in this article is in the free plan. One snippet for web and apps, up to 10 sites.
Start freeProduct thinking means judging work by the change it creates in customer behaviour, not by whether it shipped. Treat each feature request as one option for a measurable outcome, rank options by expected movement per week of effort, and set a checkpoint. Less than a third of ideas move their target metric in controlled tests.
What you will learn
- Write the outcome as a countable behaviour change with a baseline and target, such as 12% of accounts today and 30% by quarter end
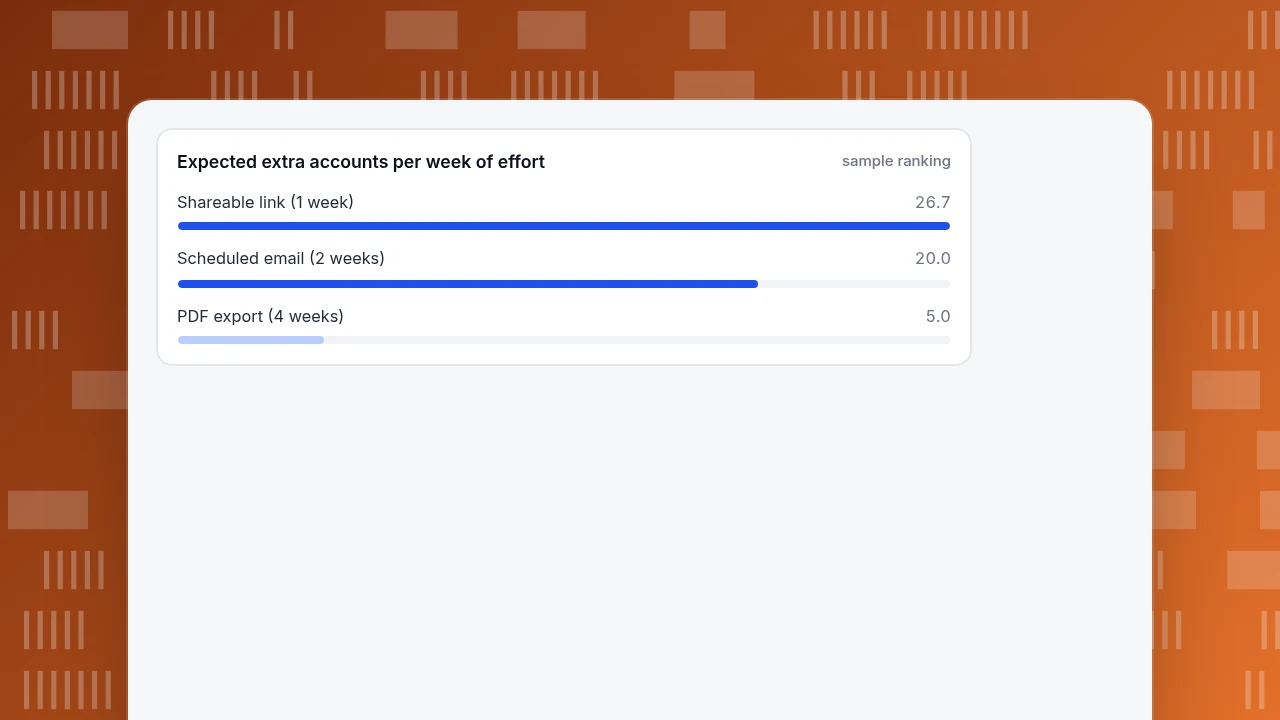
- Rank options by expected movement in the outcome per week of effort; in the sample, a one-week link beat a four-week PDF export 26.7 to 5.0
- Plan for most ideas to miss: Bing reported less than a third of ideas moved their target metrics, so set a checkpoint rule before building more
What is product thinking, in one test?
Product thinking means treating what you build as a means to a change in customer behaviour, and judging the work by that change. Teresa Torres of Product Talk puts the split plainly: an output is something you build or produce, a feature or project your team ships; an outcome is a change in customer behaviour or a business result. She quotes Josh Seiden's version: an outcome is a change in human behaviour that drives business results.
Her test is the one worth keeping in your head: ask what impact the item will have, and if the metric could be hit without actually helping customers, it is probably an output in disguise. A team is not done when the output ships; it is done when the output has its intended impact.
This guide applies that idea to the thing product people face every week, a feature request. It shows the same request framed two ways, with numbers, and gives you five questions that turn one into the other. If you build a product roadmap, these are the questions to ask of each line on it.
How does the same feature request look in each framing?
Sample request: a customer success manager forwards "customers keep asking for PDF export of the dashboard." Here is how it moves through each way of thinking.
| Step | Output framing | Outcome framing |
|---|---|---|
| What is the work item? | "Build PDF export" | "More accounts get weekly numbers to people who never log in" |
| What is the question? | How big, and when can it ship? | Who needs the numbers, to decide what? |
| What counts as done? | The button is live | The share of accounts that send numbers to a non-user rises |
| What is the metric? | Tickets closed, features shipped | Accounts sharing weekly with a non-user |
| What happens if it misses? | Nobody finds out | Next option gets tried at a checkpoint |
| Who is involved? | Engineering and the requester | Product, design, engineering and two or three customers |
Notice the right-hand column does not rule PDF export out. It treats it as one of several ways to reach the outcome, and it has a metric that can say the output did not work. The practice is to separate the three: the request (what customers ask for), the output (what you could build) and the outcome (what changes if it works).
Which five questions turn a request into an outcome?
Use these in order. They take about an hour with a customer or two, and each has an answer you can write down.
- Who asked, and what were they trying to do? "The PDF" is a solution. "Send the weekly numbers to my manager" is the job.
- What do they do today instead? Screenshots into slides, or a copied table. Current workarounds show the size of the pain and the competition you really have.
- What change in behaviour would tell you it is solved? Pick something countable: an account that sends numbers to a non-user, a user who finishes setup.
- What number says so, and what is the baseline? Write "12% of 1,000 active accounts today, 30% by the end of the quarter".
- What is the smallest thing that could move it? Often a shareable link, an email, a template, not the full feature.
If you cannot answer question 3 with something countable, you are still looking at an output.
| Disguised output | Outcome rewrite |
|---|---|
| Launch export by March | Raise the share of accounts sending weekly numbers to a non-user from 12% to 30% |
| Ship the referral feature | Raise the share of new accounts inviting a teammate in week one |
| Add course reviews | Increase the number of course views that include reviews |
| Redesign onboarding | Raise the share of new users who finish setup within 7 days |
Test each rewrite: could the number be hit without helping customers? If yes, rewrite again.
What does the worked example look like with numbers?
Sample data: a product has 1,000 active accounts. Today 120 of them (12%) send their weekly numbers to someone who does not log in. The outcome you write is 30% by quarter end, which is 300 accounts, a gap of 180.
The team lists three outputs that might close the gap, with estimates from customer conversations (assumptions, labelled as such):
| Option | Build time | Extra accounts sharing if it works | Chance it works | Expected extra accounts | Per week of effort |
|---|---|---|---|---|---|
| PDF export | 4 weeks | 60 (6% of 1,000) | 1 in 3 | 20.0 | 5.0 |
| Scheduled email report | 2 weeks | 120 (12%) | 1 in 3 | 40.0 | 20.0 |
| Shareable link | 1 week | 80 (8%) | 1 in 3 | 26.7 | 26.7 |
The "1 in 3" is not arbitrary. Dr. Harry Shum of Microsoft wrote in 2013 that when ideas are evaluated objectively in controlled experiments at Bing, less than a third move the metrics they were designed to improve, and the share is lower in an already optimised domain. A product team without that evidence should assume most good-sounding ideas miss, and plan accordingly.
Ranking by expected extra accounts per week of effort, the shareable link (26.7) beats the scheduled email (20.0), and PDF export (5.0) comes last. In output framing the team builds PDF export because the customer asked: 4 weeks for an expected 20 accounts. In outcome framing it ships the link in week 1 and sets a checkpoint:
- Checkpoint rule: after three more weeks of measurement, continue to the email report if the number of sharing accounts rose by at least 40 (half of the 80 estimate). If it rose by less, reconsider before building more.
The arithmetic is simple, but the effect is that two bad outcomes become cheap: if the link works you are done in a week, and if it does not, you have spent one week, not four. The number to remember is the ranking basis: expected movement in the outcome metric per week of effort.
Expected extra accounts per week of effort
sample rankingWhich kinds of outcome should you use?
Torres separates three kinds of metric, and mixing them is the commonest way a good-looking outcome turns into an output:
- Business outcomes: revenue up or costs down. They are lagging, and a team rarely controls them directly.
- Product outcomes: customer behaviour in the product or sentiment about it. They are leading and the team can influence them. Sentiment works best paired with a behaviour metric. "Accounts sharing weekly with a non-user" is a product outcome.
- Traction metrics: adoption of one feature, such as the share of users who opened the export screen. They look like outcomes but do not show whether customers got value, which makes them a common trap.
The rule: set the outcome at the product-outcome level, check it against the business outcome it should eventually move, and track traction only as a diagnostic.
How do you stop an outcome from turning back into an output?
Four traps appear in nearly every team:
- The disguised output. "Launch export by March" is an output wearing a date. Rewrite it as the behaviour change and check that you could hit the number without helping anyone; if you can, rewrite again.
- A metric the team cannot influence. Quarterly revenue is real but too far from a two-week change. Move one level down.
- Too many outcomes at once. Three or four goals per team means none gets the checkpoint discipline. Pick one.
- Dropping outputs altogether. Prototypes, interviews and experiments are outputs too, and they are how you learn which ideas have an outcome. The slogan "outcomes over outputs" is not "ship nothing"; it is "know why you are shipping".
For the PM, a clean test is the question "what will we do differently if this number does not move?" A team that has no answer is not yet thinking in outcomes.
What does product thinking change in a growth team?
For teams working on growth, the same habits apply to experiments. Replace "launch the referral feature" with "raise the share of new accounts that invite a teammate in week one"; set the checkpoint before you build; and compare the paths. If you are choosing between growth loops, product-led growth strategy is the natural next read. The Scrum Guide (2020) points the same way: the Product Goal is the long-term objective for the Scrum Team, and the Product Owner is accountable for maximizing the value of the product, not the number of items shipped.
How to measure an outcome in TapCub
Here is how the team in the example would track its outcome. TapCub measures behaviour; it does not run experiments, split traffic or manage feature flags, so the checkpoint is a before-and-after comparison.
- Name the behaviour as an event. Have the product call
tapcub.track('report_shared', { channel: 'link' })when an account sends numbers to someone outside the product. One name per action; it appears in Web analytics › Events. - Define the outcome metric. In All-platform analytics › Behavior › Metrics & SQL, define "accounts sharing weekly" as the distinct-people count of that event, and set the analysis identity to account so it counts accounts rather than people. Identify logged-in users with
tapcub.loginand calltapcub.groupso each person rolls up to their account. - Mark the release. Add the shipping day in Configuration › Annotations, so the chart shows what changed when.
- Check the checkpoint. Compare the accounts-sharing line before and after the annotation against your rule (a rise of at least 40). Watch the weekly numbers in All-platform analytics › Users › Accounts, which shows active accounts and members.
- Do not mistake traction for outcome. The export screen's page views are traction; the sharing-account count is the outcome. TapCub can show both, and only one belongs in your goal.
FAQ
What is product thinking?
Product thinking is judging work by the change it creates in customer behaviour or business results, not by whether it shipped. It starts with a problem and a measurable outcome, treats features as options for reaching it, and checks the result after launch.
What is the difference between an output and an outcome?
An output is something you build or produce, such as a feature or project. An outcome is a change in customer behaviour or a business result. A quick test: if you could hit the metric without actually helping customers, it is probably an output in disguise.
How do you turn a feature request into an outcome?
Ask who asked, what job they are doing, what they do today, which countable behaviour would show it is solved, and the smallest change that could move it. Then write the baseline and target, for example 12% of accounts today and 30% by quarter end.
Do most product ideas actually work?
Often not. A 2013 Bing post by Dr. Harry Shum said that in controlled experiments less than a third of ideas move the metrics they were designed to improve, and fewer in an already optimised product. Plan for that by testing the cheapest version first.
Is product thinking the same as product management?
No. Product management is the role and its processes; product thinking is a way of reasoning that anyone on the team can use. Designers, engineers and marketers can ask the same questions about who the work is for and which behaviour should change.
Sources
- Teresa Torres, Product Talk. Outcomes vs. Outputs: What's the Difference and Why Does It Matter? March 18, 2026 — definitions, the test, three types of outcomes.
- Dr. Harry Shum, Bing Search Quality Insights. Large Scale Experimentation at Bing. August 8, 2013 — less than a third of ideas move their target metrics.
- Ken Schwaber and Jeff Sutherland. The Scrum Guide. November 2020 — Product Goal and Product Owner accountability.
Was this article helpful?
We use your answers to fix and expand this page.
Couldn’t send. Please try again in a minute.
Thanks for the feedback. We’ll use it to improve this page.You’ve already sent feedback on this page. Thanks.

Technical Engineer
Focuses on tracking code, SDKs, and API integrations, with practical guidance on implementation checks and troubleshooting.