Try it on your own data
Every report in this article is in the free plan. One snippet for web and apps, up to 10 sites.
Start freeA roadmap is only as good as the evidence behind its order. This guide compares four roadmap formats, lays out an eight-step process from strategy to review, and scores five real-looking candidates with RICE using reach taken from funnel data, including the case where the lowest score still ships first and why that is fine if written down.
What you will learn
- A roadmap shows problems, order and expected outcomes, not tickets
- Combine outcome-based goals with Now / Next / Later horizons
- Take RICE reach from analytics, not from estimates
- Attach a success metric to every roadmap item
- Review after launch and change the roadmap when metrics do not move
What is a product roadmap?
A product roadmap is a shared plan that shows what a product team intends to work on, why, and roughly when. A good roadmap connects strategy (where the product should go) to delivery (what gets built next), and gives sales, support, leadership and customers a common picture of priorities.
A roadmap is not a backlog, and it is not a release plan. The backlog is the full list of possible work; the release plan schedules specific tickets into sprints. The roadmap sits above both and answers: which problems are we solving, in what order, and how will we know it worked?
Types of product roadmaps
| Type | Organized by | Strengths | Risks |
|---|---|---|---|
| Timeline / feature-based | Features on a calendar (Q1, Q2) | Easy for sales and partners to read | Turns guesses into promises; dates slip |
| Now / Next / Later | Time horizons without dates | Honest about uncertainty; easy to update | Less useful for date-driven commitments |
| Theme-based | Customer problems or goals ("faster setup") | Keeps focus on why; flexible on how | Needs translation into concrete work |
| Outcome-based | Metrics to move ("activation from 32% to 40%") | Ties work to results; easy to judge success | Requires reliable measurement |
Most teams combine them: an outcome-based roadmap for the next two quarters, organized as Now / Next / Later, with dates only on committed external launches.
| Type | Organized by | Best for |
|---|---|---|
| Timeline | Features on a calendar | External launch commitments |
| Now / Next / Later | Horizons, no dates | Honest communication of uncertainty |
| Theme-based | Customer problems | Keeping focus on why |
| Outcome-based | Metrics to move | Judging success |
Most teams mix outcome goals with Now / Next / Later horizons.
How to build a product roadmap, step by step
- Start from strategy and one or two goals. A north star metric or a metric tree tells you which outcomes matter. See also OKR vs KPI.
- Collect problems, not features. Gather inputs from analytics (where users drop off), support tickets, sales calls and product discovery interviews. Write each as a problem: "70% of users who open the schedule dialog leave without saving".
- Size each opportunity with data. How many users hit the problem per quarter? How much does it cost in conversion or retention?
- Prioritize with a transparent framework. RICE, ICE, Kano or opportunity scoring. The framework matters less than writing down the assumptions.
- Group into themes and horizons. Now (committed, in progress), Next (planned, being scoped), Later (directional).
- Attach a success metric to every item. "Ship onboarding checklist" becomes "raise week-1 activation from 32% to 38%".
- Share it by audience. Executives need outcomes and themes; engineering needs scope and dependencies; customers need direction, not dates.
- Review on a fixed cadence. Monthly for Now / Next, quarterly for the whole roadmap, and after each launch's results come in.
Worked example: prioritizing with RICE and analytics data
RICE, introduced by Intercom, scores each item as (Reach × Impact × Confidence) ÷ Effort:
- Reach: users affected per quarter, taken from analytics rather than guessed.
- Impact: 3 = massive, 2 = high, 1 = medium, 0.5 = low, 0.25 = minimal.
- Confidence: 100% (data-backed), 80% (some evidence), 50% (a hunch).
- Effort: person-months.
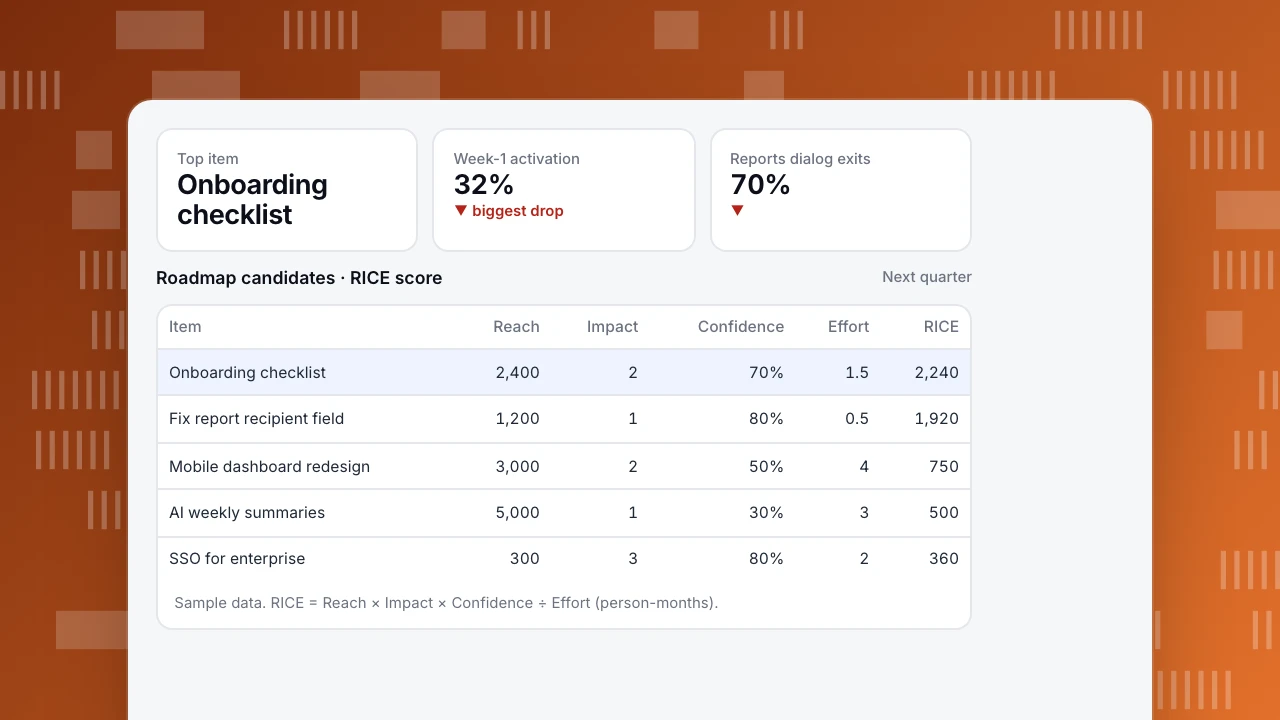
Five candidate items for a B2B analytics product (sample data):
| Item | Reach / quarter | Impact | Confidence | Effort (person-months) | RICE |
|---|---|---|---|---|---|
| Onboarding checklist | 2,400 | 2 | 70% | 1.5 | 2,240 |
| Fix report recipient field | 1,200 | 1 | 80% | 0.5 | 1,920 |
| Mobile dashboard redesign | 3,000 | 2 | 50% | 4 | 750 |
| AI weekly summaries | 5,000 | 1 | 30% | 3 | 500 |
| SSO for enterprise | 300 | 3 | 80% | 2 | 360 |
Where the inputs came from:
- Onboarding checklist: 2,400 new sign-ups per quarter; only 32% reach their first dashboard in week 1, the steepest drop in the onboarding funnel.
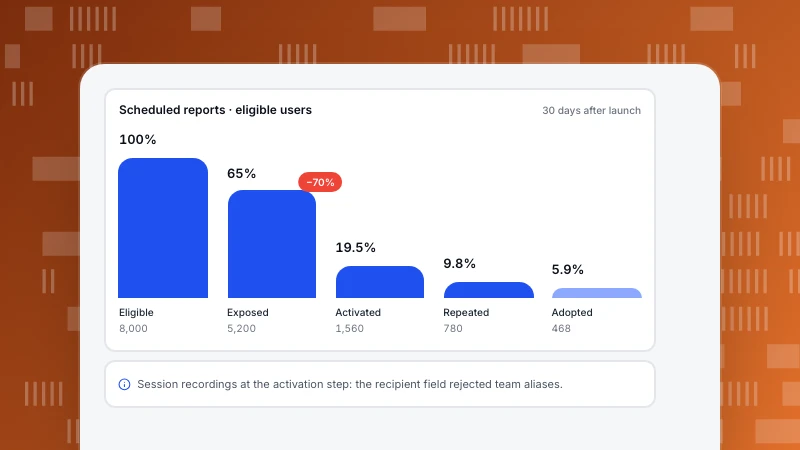
- Report recipient fix: 1,200 users a quarter open the schedule dialog and leave; session recordings show the cause. Small effort, high confidence. See feature adoption.
- AI summaries: big reach, but no evidence users want it yet, so confidence is 30%. The right next step is discovery, not building.
- SSO: small reach and lowest score, yet three enterprise deals depend on it. RICE does not capture revenue concentration; leadership may still put it in Now. That is fine, as long as the reason is written down.
The output is an ordered starting point for discussion, not a verdict.
Top item
Onboarding checklist
Week-1 activation
32%
▼ biggest drop
Reports dialog exits
70%
▼
Roadmap candidates · RICE score
Next quarter| Item | Reach | Impact | Confidence | Effort | RICE |
|---|---|---|---|---|---|
| Onboarding checklist | 2,400 | 2 | 70% | 1.5 | 2,240 |
| Fix report recipient field | 1,200 | 1 | 80% | 0.5 | 1,920 |
| Mobile dashboard redesign | 3,000 | 2 | 50% | 4 | 750 |
| AI weekly summaries | 5,000 | 1 | 30% | 3 | 500 |
| SSO for enterprise | 300 | 3 | 80% | 2 | 360 |
Sample data. RICE = Reach × Impact × Confidence ÷ Effort (person-months).
Common roadmap mistakes
- Feature factory roadmaps. A list of outputs with dates and no outcomes. Teams ship and never check whether anything changed.
- Precise dates far out. Anything beyond the current quarter is an estimate; present it as a horizon.
- Prioritizing by the loudest voice. A big customer's request or an executive's idea skips the scoring; write down the trade-off if it happens.
- No post-launch review. If the success metric did not move, the roadmap should change. Annotate launches on your charts so the before and after are visible.
- Too many items in Now. Work in progress beyond team capacity means everything ships late.
- Ignoring maintenance and debt. Reserve capacity explicitly (many teams keep 15–25%).
Using analytics to keep a roadmap honest
| Roadmap stage | Analytics question | Where in TapCub |
|---|---|---|
| Find problems | Where do users drop off? | Funnels, paths, heatmaps |
| Size reach | How many users hit this step per quarter? | Funnel step counts, segments |
| Define success | Which metric should move, from what baseline? | Goals, custom metrics |
| Launch | When did it ship? | Chart annotations |
| Review | Did adoption and the outcome metric move? | Retention, product engagement score, compare date ranges |
The roadmap changes from "what we promised to build" to "what we learned and what we will do next".
See also: Product life cycle, Technology adoption curve.
See also: Analytics for product managers.
Sources
- McBride, S. (Intercom). RICE: Simple prioritization for product managers.
- Cagan, M. (SVPG). The alternative to roadmaps.
- Atlassian. What is a product roadmap?
Was this article helpful?
We use your answers to fix and expand this page.
Couldn’t send. Please try again in a minute.
Thanks for the feedback. We’ll use it to improve this page.You’ve already sent feedback on this page. Thanks.

Product Adoption Consultant
Explores customer onboarding, live conversations, and self-service, turning common usage questions into practical guidance and improvements.