Try it on your own data
Every report in this article is in the free plan. One snippet for web and apps, up to 10 sites.
Start freeAutomated reports build themselves from your data and reach the right people on a schedule, so nobody copies numbers into a document each week. They also repeat any wrong definition faster than a person would, so the order is: fix the definitions first, then automate. Below: a one-page definitions table, four steps, a frequency guide and a worked example of the hours saved.
What you will learn
- Fix the definitions (formula, period, time zone, source, owner) before turning on a schedule, or the report repeats mistakes faster
- Choose five to seven numbers, match frequency to how fast a decision can change, and add alerts for what cannot wait
- Automation removes copy-paste, not judgment: keep a short weekly check and a written explanation of what moved
What are automated reports?
Automated reports are reports that build themselves from your data and reach the right people on a schedule, with no one copying numbers into a document each week. The schedule, the recipients and the calculation are set once; after that the report arrives whether or not anyone remembers.
That is also the risk. A report built by hand gets a second look from the person making it: a number that seems off gets checked. An automated report has no such pause. If the calculation is wrong, it is wrong every week, for every recipient, faster than before. This is why the order matters: fix the definitions first, then automate. Building a live screen instead of a scheduled report is a different job, covered in KPI dashboard and analytics dashboard; this guide is about the report that arrives on its own.
Why should you fix the definitions before you automate?
Automation copies whatever definition is in place, including an ambiguous one. The commonest ambiguity is the denominator of a rate.
Sample data: a store had 10,000 sessions, 7,000 distinct users and 280 orders in a month. Two people compute "conversion rate" without agreeing on the base.
| Definition | Calculation | Result |
|---|---|---|
| Orders per session | 280 ÷ 10,000 | 2.8% |
| Orders per user | 280 ÷ 7,000 | 4.0% |
Neither is wrong, but 4.0% is 1.43 times 2.8% (4.0 ÷ 2.8). Now put one of them in a weekly report sent to 12 people: that is 52 × 12 = 624 copies of one definition a year, and the first time finance quotes the other, the argument is about the report, not the business.
A definitions document avoids that. It is one page, and every number in the report gets one line covering six things: the metric name and formula, the period, the time zone, the source, what is excluded and the owner who answers when a number is questioned. The table below shows an example entry for each. For the period, note that in the ISO-8601 week calendar a week starts on Monday (Tableau).
Data teams make the same point in code. dbt's documentation describes defining a metric once, in version control, so every downstream tool reads the same definition instead of each analyst rewriting the query (dbt). You do not need a data team to apply the principle: one written page, one owner.
| Item to write down | Example |
|---|---|
| Metric name and formula | Conversion rate = orders ÷ sessions |
| Period | Previous Monday to Sunday |
| Time zone | The site's time zone, not the reader's |
| Source | Order records for orders, analytics for sessions |
| What is excluded | Internal traffic, test orders, bots |
| Owner | The person who answers when a number is questioned |
One page, one line per number; if two people would compute different results from it, it is not finished.
How do you automate a report? The four steps
- Fix the definitions. Write the one-page document above. If two people would compute a different number from it, it is not finished.
- Choose five to seven numbers. Pick the ones that lead to an action: for a marketing report that might be sessions, conversion rate, orders and revenue with change from the last period. A fixed, short set is easier to read, and a number nobody acts on should come out.
- Set the frequency and the recipients. Match the rhythm to how fast a decision can change (the table below). Each recipient should be someone who will act or decide.
- Flag exceptions. A report arrives on a schedule; a problem does not. Add an alert for the cases that cannot wait until the next report, such as traffic falling by a set percentage or tracking going quiet.
Step 4 is the one most often skipped, and it is what makes the schedule safe: the report covers the normal, the alert covers the abnormal.
How often should an automated report run, and who should get it?
| Frequency | Covers | Reader | Include | Avoid |
|---|---|---|---|---|
| Daily | Yesterday | Operations, on-call | One or two numbers where a day matters (errors, traffic for a launch) | A full report; daily noise trains people to ignore it |
| Weekly | Previous Monday to Sunday | Team lead, channel owner | Core numbers with change, fastest risers, new sources | Long narrative |
| Monthly | Previous calendar month | Leadership, finance, clients | The scorecard, the trend, decisions needed | Raw detail best kept in the tool |
Two checks before saving a schedule. First, who owns it? In Looker Studio, for example, whoever last edited a schedule becomes its sender, and schedules follow the editing computer's time zone (Google); a schedule with no clear owner is a schedule that breaks silently. Second, what time zone does the period use? Say it in the definitions document, because a "Monday" report built in one time zone and read in another is off by a day for some people.
Worked example: how much time does one weekly report save?
Sample data: one weekly report takes a person 2 hours by hand each week: pulling numbers, pasting them, checking them and sending. Value an hour at $40.
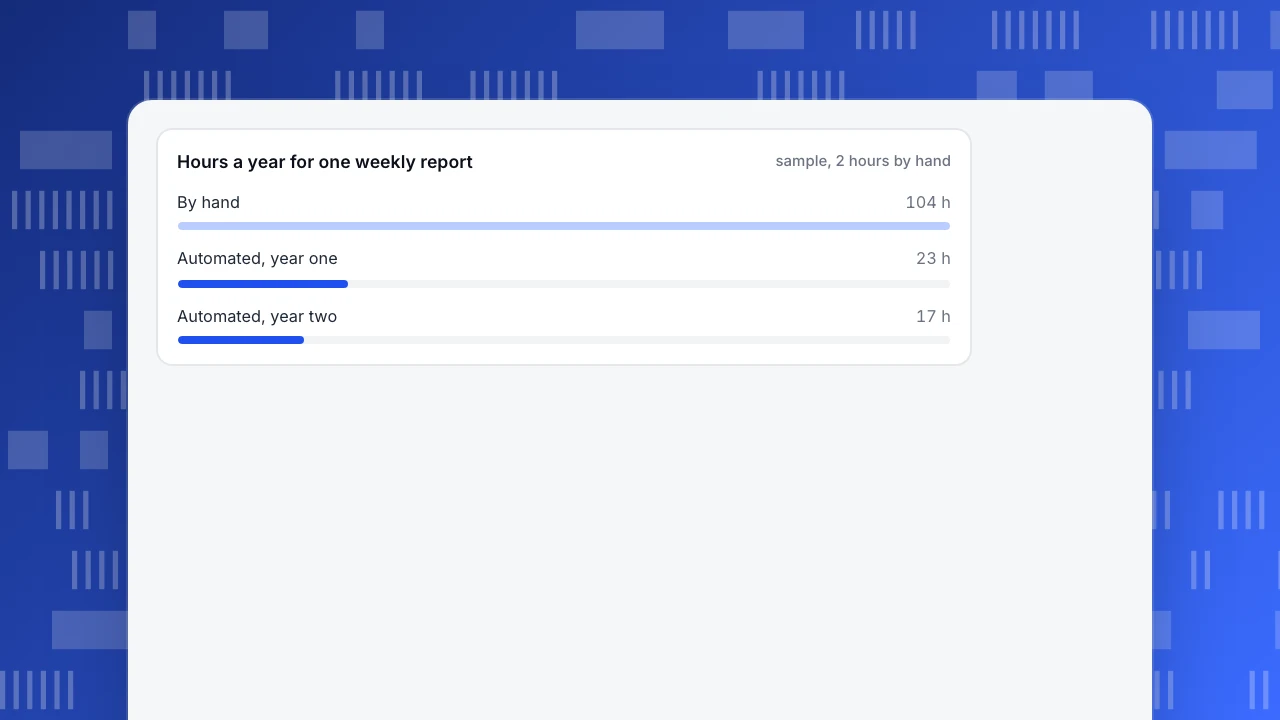
By hand. 2 hours × 52 weeks = 104 hours a year, or 104 × $40 = $4,160.
Automated.
- Setup: 6 hours, once, for the definitions document, the schedule and a test.
- Weekly check: 15 minutes (0.25 hours) to read the report and spot anything odd, 0.25 × 52 = 13 hours.
- Upkeep: 1 hour a quarter to revisit definitions and recipients, 4 hours.
- Year one: 6 + 13 + 4 = 23 hours, or 23 × $40 = $920.
Saving in year one: 104 − 23 = 81 hours, or $4,160 − $920 = $3,240. In year two the setup is gone, so the cost is 13 + 4 = 17 hours, and the saving is 104 − 17 = 87 hours.
Break-even: each week saves 2 − 0.25 = 1.75 hours, so the 6 setup hours are repaid in 6 ÷ 1.75 ≈ 3.4 weeks, which is the fourth week.
Notice that the weekly check does not go to zero. A report nobody reads for errors is the 624-copies problem again. The saving is real, but it comes from removing copy-paste, not from removing judgment.
Hours a year for one weekly report
sample, 2 hours by handWhat should you not automate?
- The interpretation. A number arriving on time does not explain why it moved. Keep a sentence or two written by a person for the changes that matter.
- Decisions. A report can list "decisions needed"; it cannot make them.
- One-off investigations. If a question will be asked once, answer it once. Automate what repeats.
- Reports with sensitive detail to wide lists. The more recipients, the more careful the content must be. A read-only link with a password and a limit on how many days it shows is safer than attaching raw data.
Common mistakes with automated reports
- Automating before defining. The 2.8% versus 4.0% gap, repeated 624 times a year.
- Too many numbers. Twenty metrics on a weekly report means none is read.
- No exception alerts. A schedule only tells you about the normal, so a drop on Tuesday waits until next Monday.
- No owner. When the person who built it leaves, nobody knows how to fix it.
- Never reading it. An automated report that has not been read for three months is a cost with no benefit; ask recipients, or stop it.
- Mixing periods. Rolling seven days in one report and Monday-to-Sunday in another gives two answers to one question.
How to automate reports in TapCub
Here is how the weekly report would be set up in TapCub. The report covers web analytics numbers; your written interpretation and any cost or revenue spreadsheet stay with you.
- Check the site time zone. Scheduled reports send at an hour you choose, in the site's time zone, so set it once under the site settings (see choose the site time zone). A weekly report covers the previous Monday through Sunday and sends on Monday; a monthly report covers the previous calendar month and sends on the 1st; a daily report covers yesterday.
- Add a delivery channel. Under Configuration › Settings › Notifications, add a channel (Webhook, WeCom, DingTalk, Feishu or email) and use Send test. Email is delivered only once the platform mail service is configured; until then sends are logged as skipped, so a chat-bot or webhook channel is the dependable choice in that case. Step-by-step: schedule email reports.
- Turn on the report. In the Scheduled reports block, switch on daily, weekly or monthly, choose the send hour and the channels, click Preview to read the body, then save; Send now pushes one immediately. The report shows visitors, pageviews, sessions, bounce rate and average duration with change from the previous period, a traffic trend, the fastest-rising pages and sources, sources that are new, the AI content ledger, conversions for enabled goals and a short written reading. The reading is written from rules first and, if a model is configured, polished by it. The documentation does not describe a way to add other metrics, so a cost or channel table stays in your own document. Weekly and monthly email reports are off on the Free plan, and the subscription needs a plan that includes scheduled reports.
- Add exceptions. In All-platform analytics › Operations › Monitors, create a monitor on a built-in metric such as visitors, with a fixed threshold or a period-change condition, and run Dry-run: it calculates only and reports how many times the last 30 days would have fired. If the answer is 12, loosen it until each alert is rare enough to be read. A monitor only notifies; it does not act. Monitors are unavailable on the Free plan.
- Share with people who have no login. Under Configuration › Settings the Public sharing tab creates a read-only link with an optional password, the modules you allow (overview, pages, sources, audience, bots) and a limit on how many days a viewer can see. Check the Delivery log at the bottom of the notifications page to confirm each send shows sent, failed or skipped.
FAQ
What are automated reports?
Reports that pull your data, calculate the numbers and send them to the right people on a schedule, without anyone copying figures into a document. The schedule, recipients and calculation are set once. The catch is that mistakes repeat just as automatically, so definitions should be fixed before the schedule is turned on.
How do you automate reporting?
Four steps: write one page of definitions (formula, period, time zone, source, owner), choose five to seven numbers that lead to action, set the frequency and recipients, and add alerts for exceptions. Then preview the first report and check it against the hand-built version once.
How often should automated reports be sent?
Match the rhythm to how fast a decision can change. Daily only for one or two numbers where a day matters, weekly for team leads and channel owners, monthly for leadership, finance and clients. A daily full report usually trains people to ignore it.
How much time can report automation save?
In the sample, a weekly report that took 2 hours by hand (104 hours a year) falls to 23 hours in year one: 6 for setup, 13 for a 15-minute weekly check and 4 for upkeep. That saves 81 hours, with the setup paid back in about 3.4 weeks. Your figures depend on the report.
Can automated reports be wrong?
Yes, and they can be wrong repeatedly. If two people define a rate with different denominators, as with 2.8% versus 4.0% in the example, the schedule just delivers that disagreement faster. Keep a human check on the first few reports and add alerts for sudden changes.
See also: Analytics for Agencies: Structure Multi-Client Reporting That Scales.
See also: Dashboard Reporting: Turn a Dashboard into a Report That Gets Acted On.
See also: Analytics Reporting: How to Write a Report That Drives a Decision.
See also: Progress Report: How to Write One People Read in a Minute.
Sources
- dbt Labs. About MetricFlow. Defining metrics once in version control so downstream tools use one definition.
- Tableau Help. ISO-8601 Week-Based Calendar. Weeks in the ISO-8601 calendar start on Monday.
- Google Cloud. Schedule automatic report delivery (Looker Studio). Schedule ownership, sender and time zone behavior, used as an example.
Was this article helpful?
We use your answers to fix and expand this page.
Couldn’t send. Please try again in a minute.
Thanks for the feedback. We’ll use it to improve this page.You’ve already sent feedback on this page. Thanks.

Data Analyst
Explores traffic sources, conversion funnels, and retention, using clear metric definitions and concrete examples to explain what the numbers mean.