Try it on your own data
Every report in this article is in the free plan. One snippet for web and apps, up to 10 sites.
Start freeAutomated SEO monitoring works when you decide in advance what to watch and what change should wake someone up. Group signals into crawl, indexing, ranking and clicks, give each one a threshold and an owner, and test every rule on past data first. Too many alerts is the same as none.
What you will learn
- Four signal classes, four rules: crawl, indexing, ranking and clicks, each with an owner and a first check
- Compare clicks with the same weekday and rank with a 7-day mean, or weekends and daily swings will create false alarms
- Dry-run each rule on 30 days of history: in the sample, ±10% fired 14 times, ±30% fired 3 and ±50% missed both real incidents
What is automated SEO monitoring, and what is it not?
Automated SEO monitoring means a system checks your search signals on a schedule, compares them with a threshold, and tells a person when one is crossed. That is all it does. It does not diagnose, and it does not fix: a monitor that fires is a smoke detector, not a firefighter.
The design question is therefore not "which tool?" but two earlier ones: what do we need to watch, and what change is big enough to wake someone up? The second question is the hard one. Set thresholds too tight and the team learns to ignore every alert; set them too loose and the first alert arrives after the damage. An alert nobody acts on is worse than no alert, because it trains people to dismiss the next one.
This article gives you four signal types, a starting threshold for each, and a way to test a rule before it goes live. It stays at the level of rules; for the details of crawl problems themselves, see crawl errors.
Which four signals should you watch, and with what thresholds?
Group everything into four classes. Each answers a different question, and each has a different owner, which is why they get separate rules.
| Signal | What you watch | Starting threshold (a starting point, not a standard) | Who acts, and the first check |
|---|---|---|---|
| Crawl | Fetches per day by search engines, 5xx and 404 counts, host availability | Fetches in 24 hours below 30% of the 7-day daily average; any day with a spike of 5xx | Developer: server logs, recent deployment |
| Indexing | Number of indexed pages and new "not indexed" reasons | Indexed pages down 10% or more week over week | SEO owner: page indexing report, robots rules, noindex tags |
| Ranking | Average position of your top pages, as a 7-day mean | 7-day mean worse by 2 positions against the previous 28 days | SEO owner: what changed on those pages, ranking-update history |
| Clicks | Clicks from search, compared with the same weekday | Down 30% or more against the same weekday average | SEO owner: Performance report by page, query and device |
These four are ordered by how fast a problem becomes visible. Crawl problems show within hours, indexing within days, rankings and clicks within one to two weeks. A well-designed set of rules catches the same incident at several points: a bad deployment might show up first as a crawl drop, then as fewer indexed pages, then as lost clicks. Google's own guide to debugging traffic drops follows the same logic: it separates technical problems, which it says usually appear in the Crawl Stats and Page indexing reports, from algorithm updates and seasonal changes.
| Monitor condition | Compared with | Good for |
|---|---|---|
| Fixed threshold | The current value and a number you enter | Hard limits such as error rate above 5% |
| Period change | Percent change against the previous period | Traffic drops between two periods; quiet if the previous period has no data |
| Forecast band | Mean of the last 7 days and the same weekday; strict about ±10%, medium ±30%, loose ±50% | Metrics with a weekly rhythm; skipped until 14 days of history |
| Anomaly | Mean and spread of the same weekday over 28 days | Metrics with enough history, about 30 days by default |
| Collection gap | Minutes with no data | Tracking broken or script removed |
TapCub monitor conditions (All-platform analytics › Operations › Monitors); a dry run reports how many times the last 30 days would have fired.
How do you alert on crawl problems?
Crawl signals come from server-side records or Google's Crawl Stats report. They matter most because they are the earliest and the cheapest to confirm. Google's documentation describes what the status codes mean for your pages:
- 404 and 410: Google treats the content as gone, removes already-indexed URLs, and gradually crawls them less.
- 5xx errors: Google temporarily slows crawling; URLs that keep returning server errors are eventually dropped from the index.
- 429: treated as a sign of overload, the same as a server error.
So one burst of 5xx errors is a technical incident; a week of them is an indexing incident. The Crawl Stats report adds a host status for the past 90 days (robots.txt fetching, DNS resolution, server connectivity) and marks a recent issue in red when it happened in the last week.
A practical rule is to alert on a drop in total fetches rather than on an absolute number. Sample data: a search engine fetches an average of 1,200 pages a day over seven days. The 30% rule fires below 1,200 × 0.3 = 360 fetches in 24 hours. On a day with 310 fetches the alert fires: the crawler may have been blocked or the server may have been unreachable. A day with 900 does not fire: ordinary variation. For deeper background on how crawl rates are set, see crawl budget.
How do you alert on indexing without alert fatigue?
Alert on the change in indexing, not on the level. Google's page indexing report lists many "not indexed" reasons that are normal: alternate pages with a proper canonical, URLs marked noindex on purpose, redirects. "Crawled - currently not indexed" is described as common and not necessarily a problem. If you alert on the level of any of these, you will be alerted every day.
What matters is a sudden fall in pages that should be indexed. Sample data: 2,400 valid indexed pages last week and 2,100 this week. The change is 2,100 ÷ 2,400 − 1 = −12.5%, which crosses the 10% rule (the threshold is 2,160). The likely causes are a noindex tag or a robots rule shipped by accident, a canonical change, or a template bug. The first check is which URLs changed status, not what Google "decided".
For a growing site, compare to a baseline that grows too: indexed pages ÷ sitemap URLs, with the same 10% change rule.
Why must you not alert on daily rank swings?
Average position bounces from day to day even when nothing is wrong. Sample data: a page's daily average position over a week is 4.2, 4.8, 3.9, 4.5, 5.1, 4.3, 4.6. The mean is 4.49 and the spread between best and worst day is 1.2 positions. A rule such as "alert if position is worse than 5.0" fires on the fifth day of a perfectly healthy page.
Use a 7-day mean against the previous 28 days instead, and require a larger move. The next week the page's positions are 6.6, 7.0, 6.8, 7.2, 6.9, 7.1, 6.8, a mean of 6.91. That is 6.91 − 4.49 = 2.4 positions worse than normal, which crosses the 2-position rule. Ordinary swings of about ±0.6 never reach it.
Position is also an average over queries and devices, which Google itself advises reading with caution. Treat a ranking alert as "go look", never as a verdict. Alert on your 20 or so most important pages, not on every keyword.
How do you set a click alert that respects the weekly cycle?
Clicks are the signal that matters most to the business, and the one most easily mis-set. The trap is the weekday pattern. Sample data: a site gets 1,100 clicks on a weekday and 600 on a weekend day. Its average over seven days is (5 × 1,100 + 2 × 600) ÷ 7 = 957.
If the rule is "alert when today is 30% below the last 7-day mean", every Saturday triggers: 600 ÷ 957 − 1 = −37%. These are false alarms, produced by the rule rather than by any problem, and people soon stop reading them. Compare with the same weekday instead, so that Saturday is compared with earlier Saturdays.
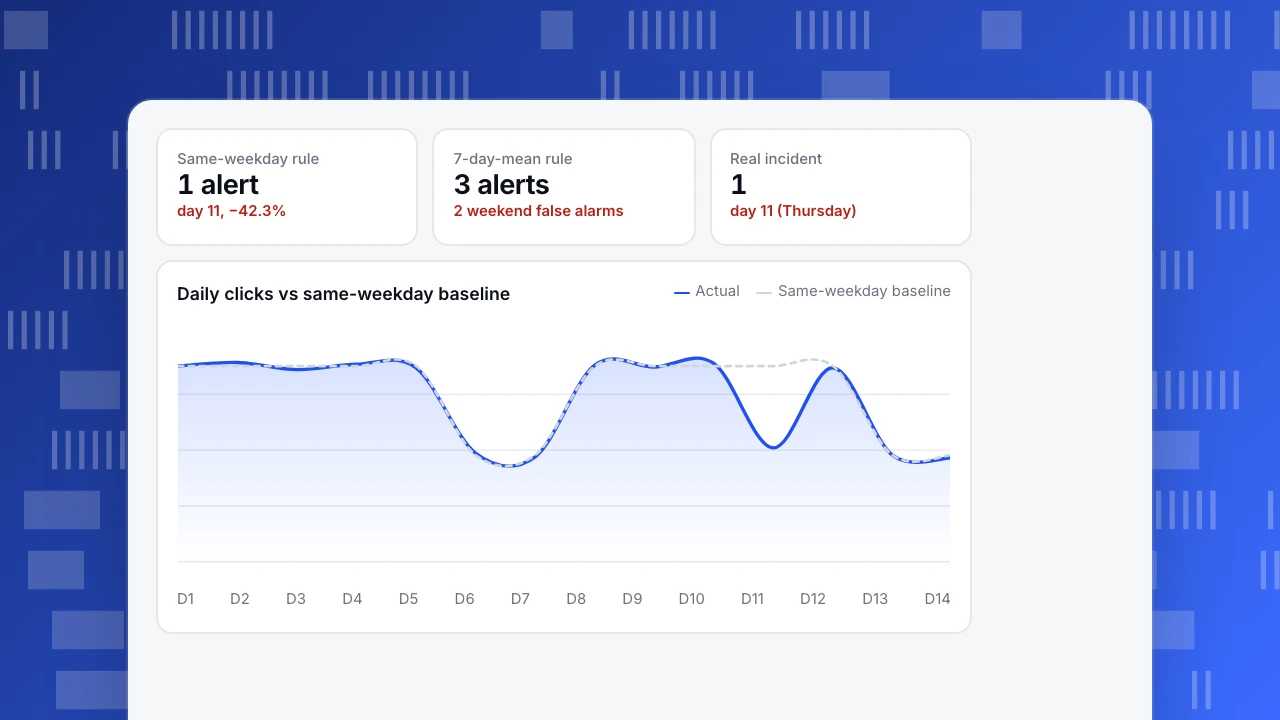
Over two weeks the difference looks like this: with the 7-day mean rule, days 11, 13 and 14 all fire, one real incident (Thursday, 640 clicks) and two false alarms (weekends). With the same-weekday rule only day 11 fires: 640 against 1,110 is −42.3%. One alert, and it is real.
Same-weekday rule
1 alert
day 11, −42.3%
7-day-mean rule
3 alerts
2 weekend false alarms
Real incident
1
day 11 (Thursday)
Daily clicks vs same-weekday baseline
ActualSame-weekday baselineHow do you test an alert before you turn it on?
Run the rule against history first. A dry run replays a rule over the past period and counts how often it would have fired. This turns "pick a number" into a measurement. Sample data: the same traffic metric tested at three sensitivities over 30 days.
| Sensitivity | Band around the same-weekday baseline | Would have fired (30 days) | Verdict |
|---|---|---|---|
| Strict | ±10% | 14 times | Noise: people would mute it |
| Medium | ±30% | 3 times | Two real incidents and one holiday: keep |
| Loose | ±50% | 0 times | Misses both real incidents |
Choose the setting that fires a handful of times per month and catches the real incidents. A good target is no more than a few alerts per rule per month; if a rule fires weekly with nothing found, loosen it.
How do you keep alerts useful over time?
Alerts decay: sites change, seasons shift, and the person who set a rule leaves. Three habits keep them useful.
- Write a one-line runbook per alert. Format: owner, first thing to check, when to escalate. Example: "Crawl drop: developer, check server logs and last deployment, escalate if not fixed within a day."
- Cap the number of alerts. Around five rules per site is workable: one per signal, plus one for errors. Each new alert must replace one or pay for itself.
- Delete or change a rule that fires three times with no action. Three false alarms in a row is a threshold problem, not bad luck.
Add context to the chart too. Mark releases, migrations and campaigns as annotations, so that when an alert fires you can see in seconds whether you did something that day.
How to set this up in TapCub
Take the weekday example above: a traffic metric that must alert on a real drop but not on weekends. Here is how you would set it up in TapCub.
- Open All-platform analytics › Operations › Monitors and create a monitor on a built-in metric such as visitors (
uv) with the Forecast band condition. It compares with the mean of the last 7 days and the same weekday, so weekends are not false alarms, and it is skipped until 14 days of history exist. Strict is about ±10%, medium ±30% and loose ±50%. - Click dry run before saving. It only calculates, sends nothing, and reports how many times the last 30 days would have fired. Pick the band that gives a handful of hits, as in the table above.
- Pick notification channels (Webhook, WeCom, DingTalk, Feishu or email; if you choose none, every enabled channel is used). A notification is not repeated for about 60 minutes, and three hits in a row pause the rule.
- Open Configuration › Settings › Notifications and turn on the operational alerts you need: traffic drop, crawl anomaly and error spike. The crawl anomaly alert fires when one search engine's fetches in 24 hours fall below 30% of its 7-day daily average, which is the crawl rule above.
- For the other signals, review Monitoring › Crawl health and Monitoring › Crawler compliance for crawl problems, and Monitoring › Search performance (after connecting Google Search Console or Bing Webmaster) for clicks and impressions by page. Mark releases in Configuration › Annotations.
Know the limits. TapCub only notifies: it will not fix, redirect or block anything. Monitors cover pageviews, visitors, sessions, bounce rate, average duration, error rate, error count or a saved custom metric; they do not read Search Console clicks, rankings or indexed-page counts, so review those in Search performance (data is usually 1–3 days late) and in Google's page indexing report. Crawl health needs server-side records (script-only collection has no status codes) and covers search engine and AI crawlers, not SEO tool crawlers.
FAQ
What is automated SEO monitoring?
It is a scheduled check of crawl, indexing, ranking and click signals that notifies a person when a threshold is crossed. It detects problems; diagnosing and fixing them stays with your team.
What should an SEO monitoring dashboard show?
One tile per signal class (crawl, indexing, ranking, clicks), each with its current value, the threshold and the last alert. For the full layout, see the SEO dashboard guide; a dashboard shows state, while alerts interrupt only when a threshold is crossed.
How often should SEO monitoring run?
Crawl and error rules can run hourly or daily. Indexing and clicks fit a daily check, ranking a weekly one. Search data is usually a day or more late, so a rule cannot be faster than its data.
How many SEO alerts are too many?
If an alert fires and nobody acts three times in a row, or a site has more than about five rules, you have too many. Merge or delete them, and test every new one with a dry run.
How do you monitor an SEO program?
Run the four alert rules daily, review the four signals weekly, and write a monthly report with the actions for next month. The report structure is in SEO KPIs.
Sources
- Debugging drops in Google Search traffic (Google Search Central)
- How HTTP status codes, and network and DNS errors affect Google Search (Google Search Central)
- Crawl Stats report (Search Console Help)
- Page indexing report (Search Console Help)
Was this article helpful?
We use your answers to fix and expand this page.
Couldn’t send. Please try again in a minute.
Thanks for the feedback. We’ll use it to improve this page.You’ve already sent feedback on this page. Thanks.

Technical Engineer
Focuses on tracking code, SDKs, and API integrations, with practical guidance on implementation checks and troubleshooting.