Try it on your own data
Every report in this article is in the free plan. One snippet for web and apps, up to 10 sites.
Start freeA B2B customer journey is the path an organisation takes from noticing a problem to renewing a contract, and it belongs to the account, not to one person. Several people join at different times, so stages should be read per account. Read person by person and one engineer's trial looks like company-wide interest. Below: five stages with signals, a worked health-score example and the mistakes to avoid.
What you will learn
- Measure stages per account: the unit is the company, and several people sit in different places at once
- Read a health score together with member count; a one-person account can score higher than a real multi-person adoption
- Before anyone logs in you only have visitors, so label stages 1 and 2 as visitor data, not account data
Why a B2B journey belongs to the account, not the person
In a B2C purchase one person sees an ad, compares options and pays. In B2B the buyer is a group. A champion finds the product, an engineer tests it, a manager asks for security answers, finance approves the budget. Academic work on organisational buying has described this group since 1972 as the buying center: everyone in the company who takes part in the purchase decision (Webster and Wind). Gartner expects most of the contact between suppliers and these groups to happen in digital channels, 80% of B2B sales interactions by 2025 (Gartner, 2020), so the trail those people leave in your product and site is increasingly what you have to read.
The practical consequence is that the unit of analysis changes. This is the difference in one table:
| Person-level journey | Account-level journey | |
|---|---|---|
| Unit | One visitor or user | One company, team or workspace |
| Typical question | Did this user sign up, activate, pay? | Is this organisation adopting the product? |
| Who acts | One person | Several people, at different times |
| Length | Minutes to weeks | Weeks to many months |
| What a "stage" means | Where this person is | The furthest point that enough of the group has reached |
| Typical failure | Counting sign-ups as customers | Calling an account "engaged" because one person is |
The failure in the last row is the one this guide is about. If one engineer runs a 25-day trial and nobody else logs in, a person-level view shows a highly engaged user. At account level the same data says: one member, no second thread, no buyer in sight. Stage-by-stage definitions of a general SaaS journey are in SaaS customer journey; how to draw a map is in customer journey map. Here the focus is how to measure stages once there are several people inside each account.
The five account-level stages and the signal for each
Five stages cover most B2B SaaS journeys. What matters for measurement is that each one has a signal you can observe at account level, and that the data source changes along the way. Before anyone logs in, you only have anonymous visitors; accounts exist in your data from the first identified user onward.
| Stage | Account-level question | Signal to watch | Data you have |
|---|---|---|---|
| 1. Problem aware | Is anyone from the target segment finding us? | Visits to problem and comparison pages by channel | Anonymous visitors only |
| 2. Evaluating | Is a real evaluation under way? | Pricing, docs and security page views; repeat visits within 14 days; a demo or trial request | Visitors, then the first identified person |
| 3. Trial or pilot | Did more than one person try it? | Second and third member identified under the same account | Accounts begin here |
| 4. Adopted | Is the group using it regularly? | Share of members active in 30 days, active days, last seen | Accounts with members |
| 5. Expanding or renewing | Is usage growing or fading before the renewal? | New members, new teams, a falling health score | Accounts, plus contract data from outside |
Two notes on this table. Stages 1 and 2 are measured on visitors, so be honest in reports: you cannot say "an account visited the pricing page" unless the visitor was identified or your sales team matched them. Stage 5 needs contract and renewal dates, which an analytics tool does not hold; combine the two in a spreadsheet or your CRM.
Worked example: one health score, four very different accounts
Sample data: four trial and customer accounts, all read over the last 30 days. For each account we compute a 0–100 health score from three parts: share of members active in the last 30 days (up to 40 points), share of the 30 days with activity (up to 30 points) and recency (30 points if last seen within 7 days, 15 within 30 days, otherwise 0). This is the scoring TapCub uses on its Accounts page; any scheme with similar parts works the same way.
Acme: 6 members, 3 active, active on 12 of 30 days, last seen 4 days ago
- Active members: 3 ÷ 6 = 50%, so 50% × 40 = 20 points.
- Active days: 12 ÷ 30 = 40%, so 40% × 30 = 12 points.
- Recency: within 7 days = 30 points.
- Health = 20 + 12 + 30 = 62.
Birch: 1 member, 1 active, active on 25 of 30 days, last seen today
- Active members: 1 ÷ 1 = 100% × 40 = 40. Active days: 25 ÷ 30 = 83.3% × 30 = 25. Recency: 30.
- Health = 95.
Cedar: 12 members, 2 active, active on 6 of 30 days, last seen 20 days ago
- 2 ÷ 12 = 16.7% × 40 = 6.7; 6 ÷ 30 = 20% × 30 = 6; recency within 30 days = 15.
- Health = 6.7 + 6 + 15 = 27.7, about 28.
Delta: 4 members, 4 active, active on 20 of 30 days, last seen yesterday
- 100% × 40 = 40; 20 ÷ 30 = 66.7% × 30 = 20; recency = 30. Health = 90.
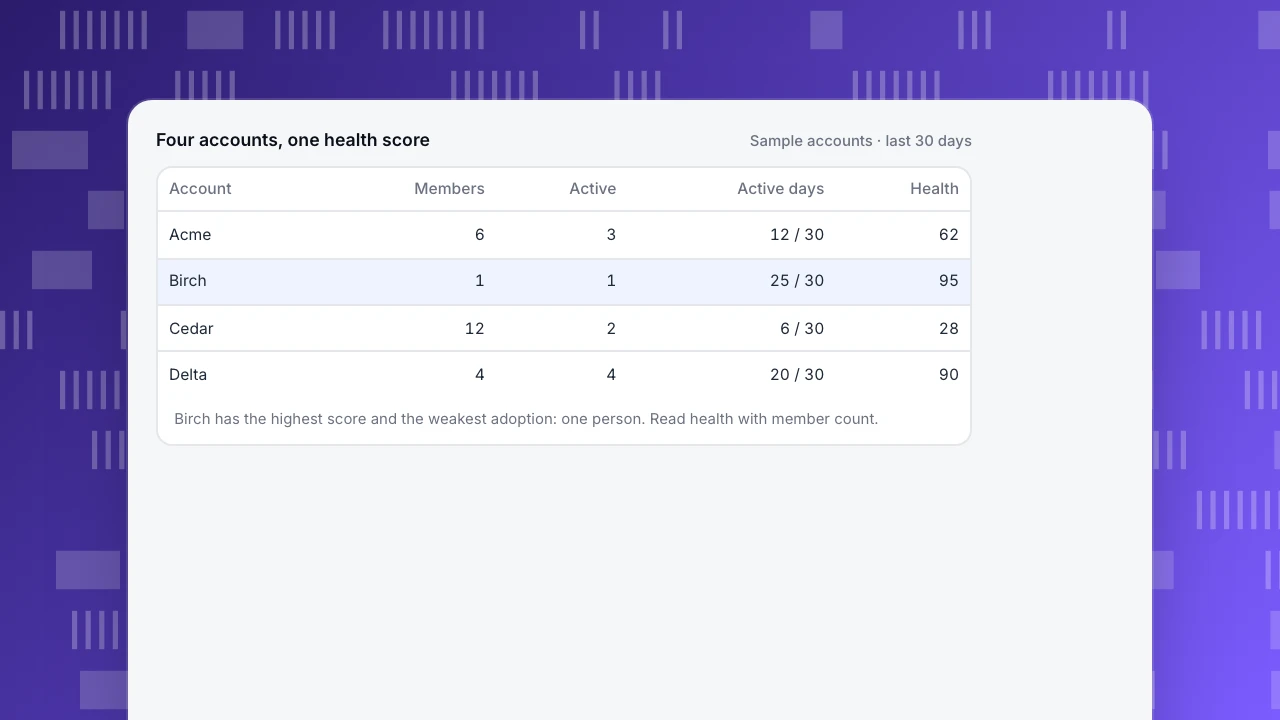
| Account | Members | Active members | Active days | Last seen | Health |
|---|---|---|---|---|---|
| Acme | 6 | 3 | 12 / 30 | 4 days ago | 62 |
| Birch | 1 | 1 | 25 / 30 | today | 95 |
| Cedar | 12 | 2 | 6 / 30 | 20 days ago | 28 |
| Delta | 4 | 4 | 20 / 30 | yesterday | 90 |
Look at Birch. It has the highest health score of the four and the weakest real adoption: one person. A health score rewards the share of members who are active, so a one-person account scores as if everyone in it were engaged. Acme, at 62, is the more promising account. Three people use it, and the company is already a multi-person buyer. Cedar is the opposite problem: twelve people were invited, ten did nothing, and it needs a rescue conversation.
The lesson is to read a score together with member count. A simple rule for the sample: a score of 70 or more counts as adopted only if at least 3 members are active; otherwise label the account single-threaded. By that rule Delta (4 active, 90) is adopted, Acme (3 active, 62) is on its way, Birch is single-threaded and Cedar is at risk.
How to read an account's stage from its members
Once accounts exist, you need a rule that turns many people's behavior into one stage. Use "the furthest stage that at least two members have reached", and write the rule down so everyone applies it the same way. A few decision rules that work as a starting point (all thresholds are samples; set yours from your own history):
- One identified member after 14 days of trial → mark the account single-threaded, not adopted. Ask your champion who else should see it.
- Two or more members active in the last 7 days → trial or pilot, even if no one has paid.
- Three or more active members and last seen within 7 days → adopted.
- Active members falling for two consecutive weeks → move to at risk and flag it before the renewal conversation, not at it.
- New members from a team that was not there before → expanding. Record the team in an account trait, such as department or region.
To turn this into a journey map without another tool, list the five stages in order, put one observable signal per stage, count accounts in each stage at the end of every week, and compare. The count of accounts per stage, not the count of people, is the number you take to the pipeline meeting. For a buyer-journey view of the same stages (the saas buyer journey from the customer's side) add one column that names who in the buying group usually acts at that stage: champion, user, technical reviewer or approver.
The mistakes that make B2B journey data misleading
- Counting sign-ups as accounts. In the sample, 120 identified sign-ups belonged to 48 accounts, 2.5 people per account. A person-level funnel with a 45% activation rate (54 of 120) hides that only 21 of 48 accounts, 43.8%, had an activated member. Report both, label them, and use accounts when the question is about the company.
- Treating anonymous visitors as accounts. An anonymous visit has no member behind it. A reverse-IP or company-name match from a third-party tool can suggest a company, but it is an estimate; keep it in a separate column from accounts you can actually see logging in.
- Averaging health across accounts. An average of 69 across the four sample accounts (62, 95, 28, 90) describes none of them. Show the distribution: how many accounts are above 70, between 40 and 69, below 40.
- Reading the journey as a straight line. Accounts skip stages, go back, and stall. Count where they are now, not only where they have been, and use "reached" and "currently in" as separate columns.
- Using one account's story as the journey. A very large customer can dominate stage counts if you weight by users. Count accounts, and look at the large ones separately.
For the metrics that sit beside the journey, such as how many accounts show up in a month and how often champions return, see B2B website metrics. For the marketing side of targeting the same accounts, see account-based marketing analytics.
How to read an account journey in TapCub
Take the four sample accounts and set up the same view in TapCub.
- Make people members of an account. After login, call
tapcub.login()so TapCub knows who the person is, thentapcub.group('company', 'acme', { name: 'Acme' }). One person can belong to several accounts; later events in that session stay on the account. Anonymous visitors never become members, which is why stages 1 and 2 stay on visitors. - Open the account list. Go to All-platform analytics › Users › Accounts. The top cards show the number of accounts, accounts active in 30 days and members. Sort by Health to find the Cedar-type accounts, and by Members to find the Birch-type ones. Health is blank when an account has no last-seen time; TapCub does not invent a score.
- Open one row. The account's 30-day activity, top events, members and traits are there. Use traits for department or region, and set a parent for a team under a company.
- Switch funnels and retention to account identity. In All-platform analytics › Behavior › Behavior analysis, change identity from person to account when the question is about the organisation, for instance "how many accounts get from trial to a second active member within 14 days". Rows without an account key are not counted.
- Optionally build stage maps. All-platform analytics › Business › Journey maps lets you group pages and events into up to 20 stages and read reach and drop-off. Reach there is counted in sessions, not in accounts, so use it for the page-level part of stages 1–3, not for account counts.
TapCub does not hold contracts, renewal dates or a sales pipeline, and it does not score leads; it measures what people and accounts do. Your CRM, or a spreadsheet, owns the stage label and the renewal date.
FAQ
What is the B2B customer journey?
It is the path an organisation takes from recognising a problem to buying, using and renewing a product. Several people take part, at different times and with different roles, so the journey is measured per account as well as per person. Typical stages are problem aware, evaluating, trial or pilot, adopted and expanding or renewing.
How is a B2B customer journey different from B2C?
The buyer is a group, not an individual; the cycle is longer; and the person who uses the product may not be the person who approves the spend. Because of that, the useful unit is the account. A B2C journey ends at the purchase; a B2B journey continues through adoption, expansion and renewal.
What does a B2B SaaS customer journey map look like?
A row of stages with one observable signal and one owner per stage, plus a count of accounts in each stage at the end of every week. Mark which stages you can only measure on anonymous visitors and which on identified accounts. Add contract data for the final stage from your CRM.
What is a SaaS buyer journey?
It is the same path seen from the buyer's side: how people inside the buying company discover, evaluate, justify and approve the product. The saas buyer journey adds the roles in the buying group, such as champion, user, technical reviewer and approver, to each stage.
How many stages should a B2B journey have?
Use as many as you have different decisions to make. Five covers most SaaS products: aware, evaluating, trial, adopted, expanding or renewing. More stages only help if each one has a signal you can measure and an action your team takes when an account moves into it.
See also: What Is ABX? Account-Based Experience Explained.
Sources
- Frederick E. Webster Jr. and Yoram Wind. A General Model for Understanding Organizational Buying Behavior. Journal of Marketing 36(2), 1972, pp. 12–19. The paper that introduced the buying center. Bibliographic record checked 2026-11-17.
- Gartner. Gartner Says 80% of B2B Sales Interactions Between Suppliers and Buyers Will Occur in Digital Channels by 2025. Press release, 15 September 2020. Title checked 2026-11-17; the page returns 403 to scripts.
Was this article helpful?
We use your answers to fix and expand this page.
Couldn’t send. Please try again in a minute.
Thanks for the feedback. We’ll use it to improve this page.You’ve already sent feedback on this page. Thanks.

Product Adoption Consultant
Explores customer onboarding, live conversations, and self-service, turning common usage questions into practical guidance and improvements.