Try it on your own data
Every report in this article is in the free plan. One snippet for web and apps, up to 10 sites.
Start freeAccount-based marketing focuses effort on a chosen list of companies, so it has to be measured per account, not per lead. This guide lists the metrics for each stage, works through a quarter comparing target and non-target accounts, and explains what can be measured before and after people sign in.
What you will learn
- Measure ABM per account: reached, engaged, opportunity, won
- Always compare with non-target accounts, ideally a random holdout from the target list
- Anonymous visits are hard to tie to companies; reliable account data starts at sign-up or login
Why ABM needs different metrics
Account-based marketing (ABM) targets a chosen list of companies with coordinated marketing and sales work. Lead-based metrics fit it poorly: one target account might produce one lead or ten, and five people from the same company count as five leads but one deal.
So ABM is measured per account: how many target accounts you reached, how many engaged, how many became opportunities and customers, and how they compare with accounts you did not target.
Metrics by stage
The table below lists the main metrics for each stage.
| Stage | Metric | How to calculate |
|---|---|---|
| Coverage | Accounts reached | Target accounts with any touch ÷ target list |
| Engagement | Engaged accounts | Accounts with at least N active known people or a key action |
| Engagement | Account health | Share of members active, active days, recency |
| Pipeline | Opportunity rate | Opportunities ÷ target accounts |
| Revenue | Win rate and deal size | Won ÷ opportunities; average first-year value |
| Revenue | Sales cycle | Days from first engagement to closed deal |
| Comparison | Lift vs non-target | Each rate for target vs comparison accounts |
Agree on what "engaged" means before the quarter starts.
A worked quarter
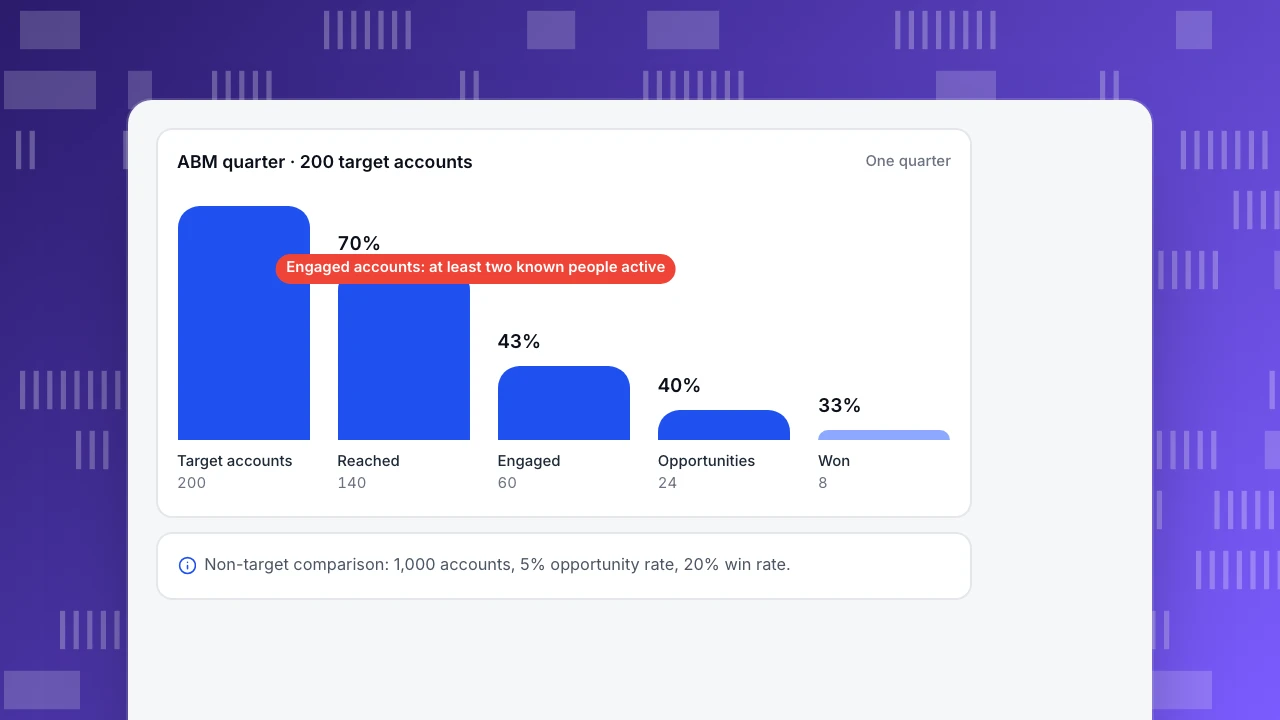
A B2B software company runs ABM for one quarter on 200 target accounts. Sample numbers throughout:
- Reached: 140 of 200 (70%) saw ads, opened emails or were contacted by sales.
- Engaged: 60 (30%) had at least two known people visit the site, attend a webinar or start a trial.
- Opportunities: 24 (12% of target accounts).
- Won: 8 (33% of opportunities), average first-year deal $36,000.
Comparison group: the same quarter, 1,000 non-target accounts that came in through normal inbound marketing produced 50 opportunities (5%) and 10 wins (20% of opportunities), average deal $14,000.
Reading it:
- Opportunity rate per account: 12% vs 5%.
- Win rate: 33% vs 20%.
- Revenue: 8 × $36,000 = $288,000 from 200 accounts, vs 10 × $14,000 = $140,000 from 1,000 accounts.
Caveat: target accounts were chosen because they looked like good customers, so part of the difference would exist without ABM. The cleaner test holds back a random part of the target list (for example 40 of 240 accounts) and compares the two.
ABM quarter · 200 target accounts
One quarterTarget accounts
200
Reached
140
Engaged
60
Opportunities
24
Won
8
What you can and cannot measure
- Before people identify themselves, most website visits are anonymous. Linking them to a company usually needs reverse-IP or third-party data, which is often inaccurate; see third-party data.
- After sign-up or login, you can link people to their company reliably and measure real engagement: who uses the product, how often, how many colleagues join.
- Sales activity (meetings, opportunities, deal values) lives in the CRM. Join it to analytics by account id.
Common mistakes
- Counting leads instead of accounts.
- No comparison group, so every target account win is credited to ABM.
- Judging ABM in one quarter when the sales cycle is two quarters long.
- Calling an account "engaged" because one person opened one email.
Account-level analysis in TapCub
TapCub groups people into accounts once they are identified: call tapcub.group('company', 'acme', { name: 'Acme' }) after login, or send the account on server events. Anonymous visitors are not members. Then:
- All-platform analytics › Users › Accounts lists accounts with members, accounts active in 30 days and a 0–100 health score (active members, active days and recency).
- Funnels and retention in Behavior analysis can switch identity to account, so "trial started → activated → upgraded" is counted per company.
- Add an account trait such as
abm_tier: targetto compare target and non-target accounts side by side.
Related: B2B website metrics, MQL vs SQL, lead tracking and customer health score.
Was this article helpful?
We use your answers to fix and expand this page.
Couldn’t send. Please try again in a minute.
Thanks for the feedback. We’ll use it to improve this page.You’ve already sent feedback on this page. Thanks.

Data Engineer
Writes about event design, data quality, and collection workflows, with verifiable implementation methods for reliable analytics.