Try it on your own data
Every report in this article is in the free plan. One snippet for web and apps, up to 10 sites.
Start freeA/B testing tools report either "statistically significant" or "probability to be best", and the two often seem to disagree. This guide explains both approaches in plain terms, analyses one test both ways side by side, and covers priors, peeking and which to choose.
What you will learn
- Frequentist results describe how surprising the data would be with no difference; Bayesian results give a direct probability
- On the same test, p = 0.097 and a 95% chance that B is better can both be correct
- Whichever you use, report the size of the difference with an interval and fix the run time in advance
Two ways to reason about uncertainty
Frequentist statistics treats the true conversion rate as a fixed, unknown number. Probability describes what would happen over many repeated experiments. The usual output is a p-value and a confidence interval: "if there were no difference, data this extreme would appear 9.7% of the time".
Bayesian statistics treats the unknown rate as something you can have beliefs about. You start with a prior belief, update it with the data, and get a posterior distribution. The usual output is a direct probability: "there is a 95% chance that B converts better than A".
Both are valid. They answer different questions, and with enough data they usually agree.
Side by side
The table below compares the two approaches on the points that matter for product and marketing tests.
| Frequentist | Bayesian | |
|---|---|---|
| Unknown rate is | A fixed number | A distribution of beliefs |
| Main output | p-value, confidence interval | Probability B is better, credible interval, expected loss |
| Uses a prior | No | Yes (can be flat) |
| Typical question answered | How surprising is this data if there is no difference? | How likely is it that B beats A, and by how much? |
| Peeking | Inflates false positives unless planned | Less fragile, but early stopping still biases |
| Common in | Classic test calculators, research | Many modern A/B testing tools |
With large samples and flat priors, the two usually lead to the same decision.
The same A/B test, analysed both ways
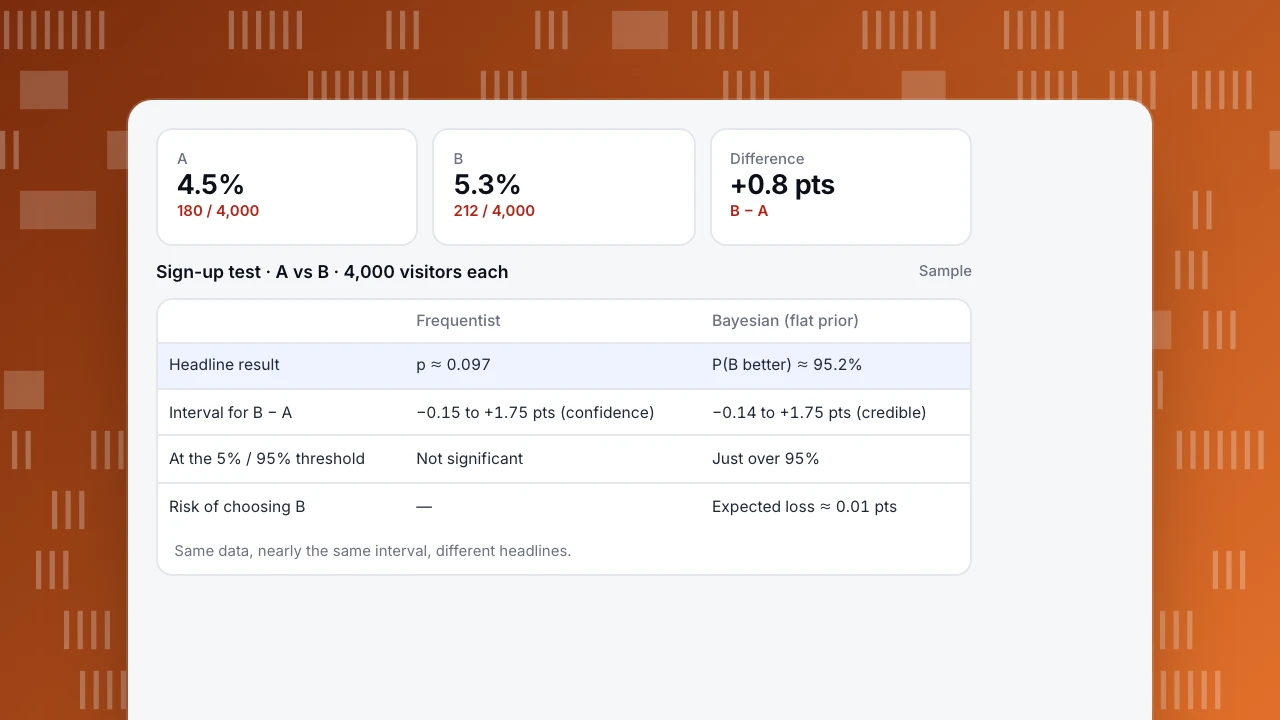
Variant A converts 180 of 4,000 visitors (4.5%). Variant B converts 212 of 4,000 (5.3%). The difference is 0.8 percentage points (sample numbers).
Frequentist analysis (two-proportion z-test):
- z ≈ 1.66, two-sided p ≈ 0.097
- 95% confidence interval for the difference: about −0.15 to +1.75 points
- Conclusion at the usual 5% level: not significant; the data does not rule out "no difference"
Bayesian analysis (flat Beta(1,1) priors for each rate):
- Probability that B is better: about 95.2%
- 95% credible interval for the difference: about −0.14 to +1.75 points
- Expected loss if you pick B and it is actually worse: about 0.01 points of conversion rate
Same data, very similar intervals, but the headlines sound different. "Not significant" and "95% chance B is better" are both correct descriptions; they answer different questions.
A
4.5%
180 / 4,000
B
5.3%
212 / 4,000
Difference
+0.8 pts
B − A
Sign-up test · A vs B · 4,000 visitors each
Sample| Frequentist | Bayesian (flat prior) | |
|---|---|---|
| Headline result | p ≈ 0.097 | P(B better) ≈ 95.2% |
| Interval for B − A | −0.15 to +1.75 pts (confidence) | −0.14 to +1.75 pts (credible) |
| At the 5% / 95% threshold | Not significant | Just over 95% |
| Risk of choosing B | — | Expected loss ≈ 0.01 pts |
Same data, nearly the same interval, different headlines.
What each result does not say
- A p-value of 0.097 is not a 9.7% chance that there is no difference. It is the probability of data this extreme if there were no difference. See p-value.
- A 95% probability that B is better is not a 95% chance that B is much better. B could be better by 0.05 points. Look at the size of the difference, not just its direction.
- Neither tells you whether the lift is worth shipping. That depends on the cost of the change and the size of the effect.
Priors, in practice
A prior is what you believe before seeing the data. With a flat prior, as above, the Bayesian interval is close to the frequentist one. An informative prior, for example "most of our tests move conversion by less than 5% relative", pulls extreme early results towards zero, which reduces false excitement. With thousands of visitors per variant, the data dominates and the prior matters little.
Peeking and stopping
Checking a frequentist test every day and stopping at the first p < 0.05 inflates false positives a lot. Bayesian results are often described as "safe to peek", but stopping the moment the probability crosses 95% still favours lucky streaks. Either way: decide the sample size or minimum run time in advance (see minimum detectable effect), run at least one full week, and use sequential methods if you must check early.
Which should you use?
- Use the method your testing tool uses, and learn how to read it correctly.
- Frequentist fits when you need a fixed error rate across many tests, or a reviewer expects p-values.
- Bayesian fits when people need a direct probability and expected loss to make a business decision.
- In both cases, report the size of the difference with an interval, not just a yes/no. See how to calculate a confidence interval.
Getting the counts from TapCub
TapCub does not split traffic or run tests, but it gives you clean inputs: conversions and visitors per variant. Send the variant as an event property, then compare the goal or funnel for each value in Web analytics › Goals or All-platform analytics with the same date range and filters. Use those counts in either analysis above. See also statistical significance.
Was this article helpful?
We use your answers to fix and expand this page.
Couldn’t send. Please try again in a minute.
Thanks for the feedback. We’ll use it to improve this page.You’ve already sent feedback on this page. Thanks.

Product Analyst
Focuses on event analysis, conversion funnels, and retention, using clear metric definitions and structured analysis to explain product performance.