Try it on your own data
Every report in this article is in the free plan. One snippet for web and apps, up to 10 sites.
Start freeA bottleneck in business is the one step in a process whose limited capacity caps what the whole process can deliver. Improving any other step changes nothing, so you find it with numbers, not opinion: conversion from the previous step, median wait, and utilisation. Below: four types, a worked five-step example, and how to estimate what fixing it is worth.
What you will learn
- Only the slowest step sets throughput; doubling the capacity of any other step gives 0%
- The bottleneck shows as a queue in front, a step near full capacity and idle steps after it
- Fix one step, then measure again: a fixed bottleneck moves to the next step
What is a bottleneck in business?
A bottleneck is the step in a process whose limited capacity caps what the whole process can deliver. Work arrives faster than that step can pass it on, so a queue builds in front of it and the steps after it sit partly idle. The name comes from the neck of a bottle: no matter how wide the bottle is, liquid leaves at the rate the neck allows.
That is why a bottleneck is a property of the whole flow, not of a single team. If a step has twice the capacity it needs, making it faster changes nothing. Only the slowest step sets throughput, which is the number of orders, tickets, sign-ups or invoices that come out the end per hour or per day.
Two more distinctions help when you read other guides:
- Short-term vs long-term. A short-term bottleneck is temporary, such as the one person who knows a task being out for three days. A long-term one is built into the process and keeps slowing output, such as a machine or approval rule that is always behind. Treat the first with cover and the second with redesign.
- Constraint vs bottleneck. Writers use the two words in slightly different ways. The theory of constraints defines a constraint as anything that prevents a system from reaching its goal; "bottleneck" usually means the resource whose capacity is below demand. For measuring, the practical test is the same: find the step that limits the output of the whole.
The rest of this guide is about the part most articles skip: how to find the bottleneck with numbers, not with opinions, and how to estimate what fixing it will give you.
Four kinds of business bottleneck
Bottlenecks usually fall into one of four groups. The group matters because each leaves a different fingerprint in your data.
| Type | What limits the flow | Typical example | Signature in the data |
|---|---|---|---|
| Capacity | A machine, room, server or fixed number of slots | One packing station for the whole warehouse | The step runs near 100% of capacity, a queue forms in front of it, later steps are idle |
| Process | The order of steps, handoffs or approval rules | Every refund needs a manager's sign-off | Long waits between steps while nobody is actually working on the item |
| People | Skill or availability concentrated in one person or team | One reviewer approves every contract | Wait time jumps on that person's days off; the same name sits on every late item |
| Systems | Software, data or integrations | A slow payment API, or re-keying data between two tools | Timeouts, retries and failures at that step rather than people simply leaving |
Real bottlenecks often mix two types. An approval rule (process) that only one person can perform (people) is common, and fixing only one half leaves the queue where it was.
| Type | What limits the flow | Typical example | Signature in the data |
|---|---|---|---|
| Capacity | A machine, room, server or fixed number of slots | One packing station for the whole warehouse | Near full capacity, a queue in front, later steps idle |
| Process | Order of steps, handoffs or approval rules | Every refund needs a manager's sign-off | Long waits between steps with nobody working on the item |
| People | Skill or availability concentrated in one person or team | One reviewer approves every contract | Waits jump on that person's days off |
| Systems | Software, data or integrations | A slow payment API, re-keying between two tools | Timeouts, retries and failures at that step |
Real bottlenecks often mix two types, for example an approval rule that only one person can perform.
Worked example: a five-step order process
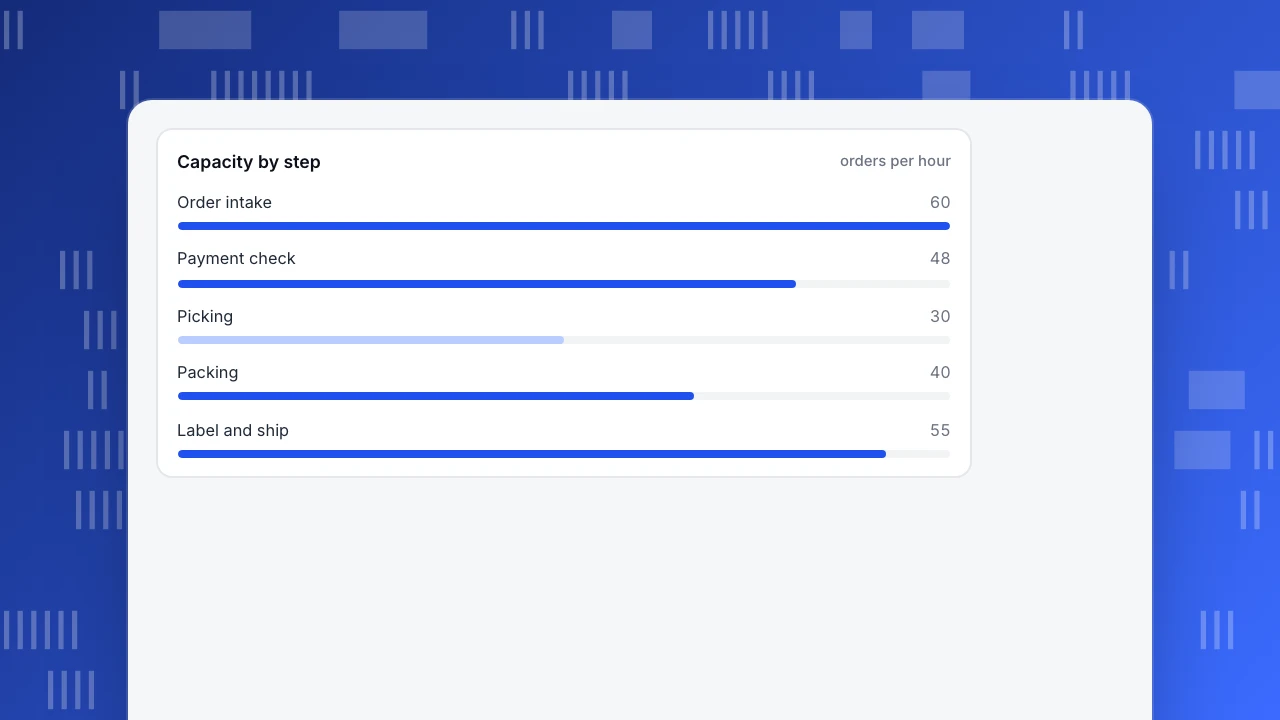
Sample data: an online store receives 45 orders per hour during its busy window. Each order passes through five steps. The capacity of each step, in orders per hour, is:
| Step | Capacity (orders/h) | Orders arriving (per h) | Orders it passes on (per h) | Utilization |
|---|---|---|---|---|
| Order intake | 60 | 45 | 45 | 45 ÷ 60 = 75% |
| Payment check | 48 | 45 | 45 | 45 ÷ 48 = 93.8% |
| Picking | 30 | 45 | 30 | 30 ÷ 30 = 100% |
| Packing | 40 | 30 | 30 | 30 ÷ 40 = 75% |
| Label and ship | 55 | 30 | 30 | 30 ÷ 55 = 54.5% |
Throughput of the whole line = the smallest capacity = 30 orders per hour, even though 45 arrive. Picking is the bottleneck. Three things in the table give it away: it is the only step at 100% utilization, it receives more than it passes on, and the steps after it are underused (75% and 54.5%) because picking starves them.
What the queue does. Every hour 45 − 30 = 15 more orders arrive than leave picking. After an 8-hour shift the backlog is 15 × 8 = 120 orders. By Little's law (average wait = number waiting ÷ throughput), an order arriving at hour 8 waits 120 ÷ 30 = 4.0 hours before it is picked. Averaged over the shift, the wait is 2.0 hours, because the backlog grows steadily from zero.
What fixing the wrong step gives you. Compare three changes:
| Change | New line throughput | Gain over 30 orders/h |
|---|---|---|
| Packing 40 → 60 (a big upgrade at the wrong step) | min(60, 48, 30, 60, 55) = 30 | 0% |
| Picking 30 → 40 | min(60, 48, 40, 40, 55) = 40 | +10 orders/h, +33.3% |
| Picking 30 → 48 and packing 40 → 48 | 45, because only 45 arrive per hour | +15 orders/h, +50% |
Doubling the capacity of the wrong step bought nothing, and a one-third improvement at the bottleneck bought a one-third improvement for the whole line. The third row shows the stopping rule: once capacity at every step covers demand, throughput equals demand and further investment is wasted. Note also that after picking reaches 40, packing is at 40 as well: the bottleneck has moved, and the next gain needs both steps to improve together.
Capacity by step
orders per hourHow to find a bottleneck in your data
Opinions about "where it gets stuck" are usually wrong because the loudest step is not the slowest one. Measure three things for every step of the process:
- Conversion from the previous step. What share of items that entered the step came out of it. A low share means items leave or fail there.
- Time from the previous step. Use the median, not the average, because a few very long cases pull an average up. A long median means items wait.
- Utilization or queue length. For physical or staffed steps, flow through the step divided by its capacity, and the number of items waiting in front of it.
Then read the pattern, as in this table:
| What the numbers show | What it usually means | Next move |
|---|---|---|
| Low conversion, short wait | A leak: people leave or give up at this step | Treat it as drop-off. See leaky bucket and drop-off rate |
| Normal conversion, long wait, queue in front | A capacity or process bottleneck: items stay, but slowly | Add capacity, remove an approval, or split the step |
| Low conversion and long wait | The step is hurting people before they leave | Look here first; check user friction |
| Utilization 100%, later steps idle | Classic bottleneck: this step starves everything after it | Improve this step only; leave the others alone |
Two warnings. First, a bottleneck is relative to demand: a step at 100% utilization at 4 p.m. may be at 40% at 9 a.m., so look at your busy window, not the daily average. Second, a step with the biggest drop-off is not automatically the bottleneck. Pareto analysis ranks causes by size; a bottleneck ranks steps by whether they cap the flow. Use both: Pareto to pick which problems matter, the bottleneck test to see which step limits the result.
Example: spotting a bottleneck in a sign-up flow
The same test works for digital flows, where the "capacity" is people's patience and the "queue" is time spent waiting. Sample data: a team tool measures 1,000 new sign-ups through five steps in a funnel.
| Step | Reached | Conversion from previous step | Median time from previous step |
|---|---|---|---|
| Sign up | 1,000 | – | – |
| Email verified | 720 | 720 ÷ 1,000 = 72.0% | 2 min |
| Workspace created | 650 | 650 ÷ 720 = 90.3% | 4 min |
| Teammate invited | 390 | 390 ÷ 650 = 60.0% | 30 h |
| First report built | 312 | 312 ÷ 390 = 80.0% | 3 h |
Only the invite step is both low (60.0%) and slow (30 hours). It also accounts for 30 ÷ (2 min + 4 min + 30 h + 3 h) ≈ 91% of the summed step medians. The sum of medians is only an approximation of total time, but the gap is large enough that rounding does not matter.
What is it worth? Compare the same 10-point lift at two different steps. If invitation conversion rises from 60% to 70%, first reports built go from 312 to 650 × 0.70 × 0.80 = 364 (+52, +16.7%). If email verification rises from 72% to 82% instead, the result is 1,000 × 0.82 × (650 ÷ 720) × 0.60 × 0.80 ≈ 355 (+43, +13.9%). The invite step wins on both counts: a point gained on a lower base is worth more in relative terms, and its 30-hour wait also delays every person who does get through. Looking only at the step that loses the most people (verification loses 280, the invite step 260) would have pointed at the wrong place.
Theory of constraints in one paragraph
The theory of constraints, introduced by Eliyahu Goldratt in his 1984 novel The Goal, turns the idea into a loop of five focusing steps: identify the constraint, exploit it (make sure it never idles or works on the wrong thing), subordinate everything else to it (do not feed it faster than it can work), elevate it (add capacity), and then repeat because a fixed constraint moves. In the order example this reads as: find picking; keep it busy with the right orders; stop intake releasing more than picking can take; add a picker or split the task; then re-measure, because packing is now at the limit. The loop is also a guard against the most common waste, which is improving a step that is not the constraint.
Common mistakes when looking for bottlenecks
- Improving the busiest-looking step. The team that shouts loudest is not always the bottleneck. Check utilization and the idle time after the step.
- Using averages for waiting. An average hides the long tail. Report the median and the 90th percentile of the wait.
- Measuring the quiet hour. At low demand, no step is a bottleneck. Measure at your peak.
- Stopping at one pass. After the first fix the bottleneck moves. Plan the second measurement before you start the first fix.
- Blaming people. If a queue forms in front of one person, the process allows only that person to do the work. Fix the process, not the person.
- Counting inputs, not outputs. A step "processing 100 items" that outputs 70 is dropping 30. Always compare items in with items out.
Finding the slowest step in TapCub
Take the sign-up example above and run it in TapCub. TapCub measures the flow; it does not change capacity, route work or model queues, so the utilization figures in the order example would come from your operations system.
- Turn each step into an event or a page. A funnel step is an event name or a page path, with 2 to 20 steps. Business steps that happen on your server, such as "picked" or "approved", can be sent as events with the server-side HTTP API. See send server-side events.
- Build the funnel in All-platform analytics › Behavior › Behavior analysis. Set the conversion window (7 days by default, up to 180). Each step shows its count, the rate against step one, the rate against the previous step, the drop-off and the median time from the previous step; the largest drop is marked. See build a funnel and read funnel drop-off.
- Read the pattern with the table above. Click a step to list the people who dropped there, then open the path view on the same page to see where they went instead. See analyze user paths.
- Check the support queue the same way. In Live chat › Reports, average first response is measured from the start of a conversation to the agent's first reply (AI replies are not counted), with a median shown alongside, and a heatmap of conversation starts by weekday and hour sits next to your office hours. If first response is slow only in certain hours, the bottleneck is staffing in those hours.
- Get told when a step regresses. In All-platform analytics › Operations › Monitors, a saved custom metric can be checked on an hourly, daily, weekly or monthly grain; a dry run tells you how often it would have fired in the last 30 days. Monitors only notify; they do not act.
The decision rule stays the same as in the example: find the step that is both slow and limiting, estimate the gain from improving it, fix that one, and measure again.
FAQ
What is a bottleneck in business?
It is the step in a process with the least capacity compared with the demand placed on it. Because everything after it can only work on what it passes on, the output of the whole process is limited to that step's rate until it is fixed or bypassed.
What are examples of bottlenecks in business?
One packing station in a warehouse, a single manager who must approve every refund, a slow payment service at checkout, a legal review that happens only on Thursdays, or a support team with no staff at the hours when most chats begin. Each is a step that holds back everything after it.
How do you identify a bottleneck?
Measure each step's conversion from the previous step, the median time from the previous step, and utilization or queue length. The bottleneck is the step with the longest queue in front of it that runs near full capacity, while the steps after it are underused.
What is the difference between a bottleneck and a constraint?
The words overlap. In the theory of constraints a constraint is anything that stops a system from reaching its goal; many practical guides call the resource whose capacity is below demand a bottleneck. For analysis you treat them the same way: find the limiting step.
Does fixing a bottleneck make the whole process faster?
Yes, until the next step becomes the limit. In the sample order flow, raising picking from 30 to 40 orders per hour lifted throughput by 33.3%, then packing at 40 became the next limit. Throughput stops improving when it reaches demand.
Sources
- Wikipedia, Bottleneck (production): definition, short-term and long-term bottlenecks.
- Wikipedia, Theory of constraints: Goldratt, The Goal (1984), the five focusing steps.
- Wikipedia, Little's law: L = λW, used for the queue-wait calculation.
Was this article helpful?
We use your answers to fix and expand this page.
Couldn’t send. Please try again in a minute.
Thanks for the feedback. We’ll use it to improve this page.You’ve already sent feedback on this page. Thanks.

Data Analyst
Explores traffic sources, conversion funnels, and retention, using clear metric definitions and concrete examples to explain what the numbers mean.