Try it on your own data
Every report in this article is in the free plan. One snippet for web and apps, up to 10 sites.
Start freeCustomer success KPIs fall into two groups. Outcome KPIs, such as churn, gross revenue retention and net revenue retention, report what already happened at renewal. Leading KPIs, such as active members, time to first value and health score, move weeks earlier. Track both, and review the leading ones weekly: a team that watches only outcomes is doing a post-mortem.
What you will learn
- Review leading KPIs weekly and outcome KPIs quarterly; outcomes cannot be acted on
- Show NRR beside logo churn and GRR: in the sample NRR is 97% while 6% of customers left
- Backtest the health score on past churners, and read it with member count
Outcome KPIs and leading KPIs: what each tells you and when
Every customer success KPI answers one of two questions. What happened at renewal? is answered by outcome KPIs: churn, gross revenue retention, net revenue retention. What is going to happen at renewal? is answered by leading KPIs: how many of the account's people are active, how often, and how quickly they reached first value. Outcome KPIs are essential for reporting to finance. They cannot be acted on, because by the time they move the customer has already decided.
| KPI | Type | Formula or definition | Review cadence |
|---|---|---|---|
| Logo churn rate | Outcome | Accounts lost in the period ÷ accounts at the start | Monthly or quarterly |
| Gross revenue retention (GRR) | Outcome | (Start ARR − churned ARR − contraction) ÷ start ARR | Quarterly |
| Net revenue retention (NRR) | Outcome | (Start ARR − churn − contraction + expansion) ÷ start ARR, for the same cohort | Quarterly |
| Active-account rate | Leading | Accounts with any activity in the last 30 days ÷ all accounts | Weekly |
| Active members per account | Leading | Distinct people active in 30 days, median across accounts | Weekly |
| Time to first value | Leading | Median days from sign-up to the event that shows value | Monthly |
| Health score | Leading | A 0–100 score combining usage signals (see below) | Weekly |
| Net Promoter Score | Survey, mixed | % promoters − % detractors | Quarterly |
NRR needs one clarification, because teams define it differently. The standard version follows a cohort: take the recurring revenue of the customers you had at the start of the period and compare it with what the same customers pay at the end. A public company's annual report describes it exactly that way (SecureWorks 10-K). New customers acquired during the period are not part of the cohort. NPS is the one entry here that comes from a survey; it was introduced in a 2003 Harvard Business Review article (Reichheld) and measures stated intent, not behavior, so it sits between the two groups.
If you remember only one rule, make it this: review the leading KPIs weekly and the outcome KPIs quarterly. A team that looks only at outcomes is writing a post-mortem. The strategy behind these numbers, such as segments, coverage models and playbooks, is in customer success strategy; this guide covers the numbers.
What the outcome KPIs show: one quarter of renewals
Sample data: a company starts the quarter with 50 accounts and $1,000,000 in annual recurring revenue (ARR). During the quarter, 3 accounts leave, taking $60,000 of ARR. Others reduce their plans by $20,000 in total (contraction), and some expand by $50,000.
- Logo churn = 3 ÷ 50 = 6.0%.
- Gross revenue retention = (1,000,000 − 60,000 − 20,000) ÷ 1,000,000 = 92.0%.
- Net revenue retention = (1,000,000 − 60,000 − 20,000 + 50,000) ÷ 1,000,000 = 97.0%.
Two things to see. First, NRR of 97% looks close to 100%, yet 6% of the customers are gone; expansion from the others covered most of the revenue loss. Report all three numbers, because NRR alone hides logo churn. Second, all three are known only after the decision. The three accounts that left can no longer be helped, and nothing in these numbers says which of the other 47 will leave next. That needs the leading side.
Build a health score from leading signals
A health score compresses several leading signals into one number between 0 and 100, so that a team can sort hundreds of accounts. A workable score has three parts that capture breadth, depth and recency of use. As an example, here is the scheme TapCub uses on accounts, which is a good template because the parts are easy to explain:
- Breadth, up to 40 points: share of the account's members active in the last 30 days.
- Depth, up to 30 points: share of the last 30 days with activity on the account.
- Recency, up to 30 points: 30 if last seen within 7 days, 15 within 30 days, otherwise 0.
Compute an account with 8 members, 5 of them active, activity on 18 of 30 days, last seen 3 days ago: breadth 5 ÷ 8 = 62.5% × 40 = 25; depth 18 ÷ 30 = 60% × 30 = 18; recency 30. Health = 73.
The weights are a judgment, not a law, so validate them. Take the accounts that churned in the last four quarters and the ones that renewed, compute each account's score 60 days before its renewal date, and check whether the churned group scored clearly lower. If it did not, the signals or weights are wrong for your product; change them. Also add what your product's value really is: a score built on logins misses an account that uses one critical feature through an API. A health score alone, without member count, can mislead; the pattern is covered in B2B customer journey, and the definition is in customer health score.
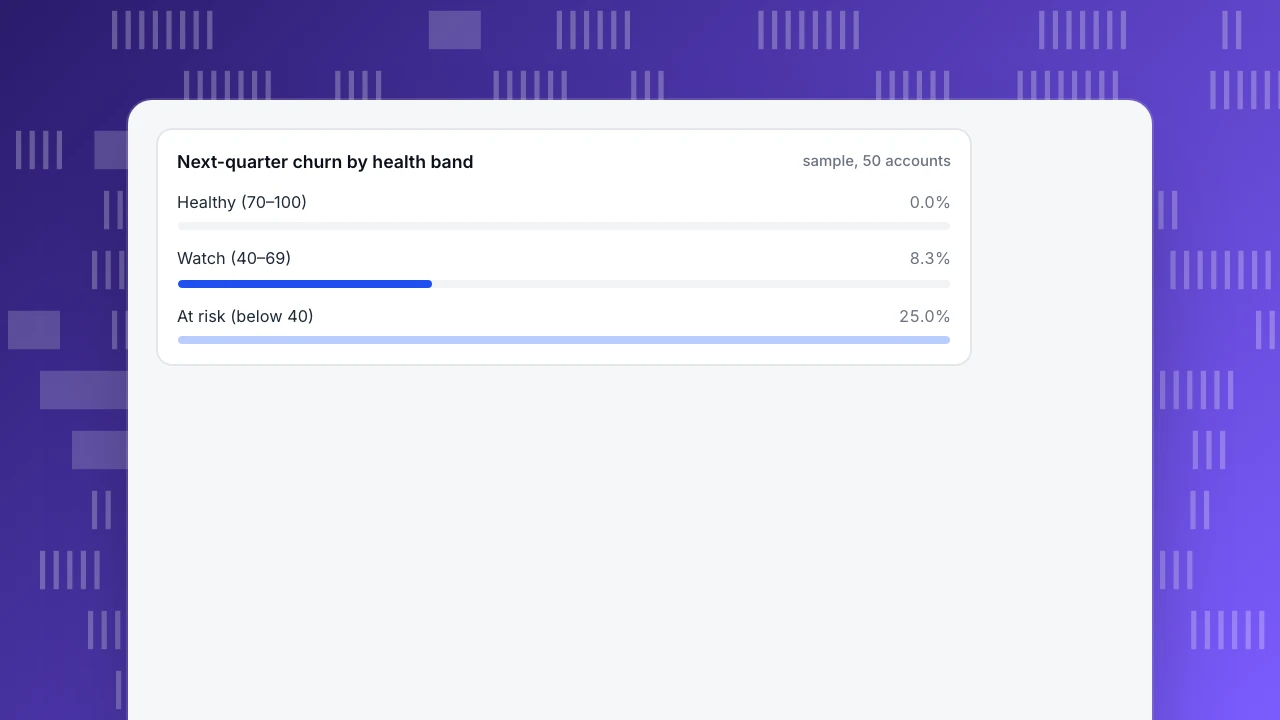
Worked example: 50 accounts by health band and the next quarter's churn
Sample data: at the start of the quarter, split the 50 accounts into three bands by health score, then record who actually left in the following 90 days.
| Band | Accounts | Churned next quarter | Churn rate |
|---|---|---|---|
| Healthy (70–100) | 30 | 0 | 0.0% |
| Watch (40–69) | 12 | 1 | 8.3% |
| At risk (below 40) | 8 | 2 | 25.0% |
| All | 50 | 3 | 6.0% |
At-risk accounts are 16% of the base (8 ÷ 50) but account for 2 of the 3 losses, 67%. That is the use of a leading KPI: it points at the accounts where effort has the highest return, weeks before the renewal conversation.
Now forecast. Suppose that at the start of next quarter the bands hold 28, 14 and 8 accounts. Apply last quarter's rates: 28 × 0% + 14 × 8.3% + 8 × 25% = 0 + 1.17 + 2.0 = 3.2 expected churned accounts. With an average ARR of $20,000 (the $60,000 ÷ 3 from the example above), that is about $63,000 of ARR at risk. This is an estimate to prioritise by, not a prediction to promise: a zero in a band of 30 accounts means "not seen yet", not "cannot happen", and with 50 accounts the rates move a lot from one quarter to the next. Recompute the table every quarter and replace the sample rates with your own history as it grows.
A customer success dashboard with six numbers
A customer success dashboard should fit on one screen and tell the team what to do on Monday. Six numbers are enough to start:
| Number | Cadence | If it moves, do this |
|---|---|---|
| Share of accounts active in 30 days | Weekly | A drop of several points: list the accounts that went quiet and call the biggest first |
| Accounts per health band (healthy, watch, at risk) | Weekly | Any account entering at risk: assign an owner within the week |
| Median active members per account | Weekly | Falling: onboarding or champion change; look at accounts with a single active member |
| Median days to first value | Monthly | Rising: fix onboarding before adding more outreach |
| GRR and NRR | Quarterly | Compare to the previous four quarters; read together with logo churn |
| At-risk list with renewal date | Weekly | Sort by renewal date, then ARR; this is the meeting agenda |
Source of each number matters. The first four come from product usage data; GRR, NRR and renewal dates come from your billing or CRM. Keep them in one view, but label which part is behavior and which part is contract data.
Retention KPIs that belong in the same set
Customer retention KPIs usually mean cohort retention: of the accounts that started in a month, how many are still active N months later. Sample data: a cohort of 40 accounts that started in January, of which 38 are active in month 1, 31 in month 3 and 26 in month 6. Rates: 38 ÷ 40 = 95%, 31 ÷ 40 = 77.5%, 26 ÷ 40 = 65%.
Read the shape, not one point. If the curve flattens after month 3, the accounts that remain have found their use, and later churn is mostly contract timing. If it is still falling at month 6, accounts are leaving after the initial setup and the problem is in adoption. Two companion measures help: how many accounts have been inactive for 14, 30 or 60 days, and what share of active days fall in a given week (stickiness). Both are leading. For the full list of retention measures see retention metrics, and for what to do with an at-risk account see churn prevention. The revenue version of retention is in net revenue retention.
Mistakes that make customer success KPIs misleading
- Averaging health scores. The mean of scores 90, 90, 90 and 10 is 70, which says healthy; one of four accounts is in trouble. Report counts per band.
- Reading NRR alone. In the sample, NRR is 97% while 6% of logos left. Always show logo churn and GRR beside it.
- Treating logins as success. A login shows presence. Count the events that show value: a report shared, a teammate invited, an integration used.
- Never backtesting the score. A score that does not separate past churners from renewers is decoration. Run the 60-days-before check once a quarter.
- Reading NPS as a forecast. A survey measures what people say; it can lag behind behavior or miss quiet accounts that never answer.
- Too many KPIs. Ten dashboards, none owned. Pick the six above, assign each to a person, and add a seventh only when one of the six cannot explain a problem.
How to track these KPIs in TapCub
Take the 50-account example and see what TapCub measures and what it leaves to your own systems.
- Group people into accounts. After login, call
tapcub.login()andtapcub.group('company', 'acme', { name: 'Acme' }). Anonymous visitors never become members, and an account without a last-seen time has no health score. - Read the leading side on the Accounts page. All-platform analytics › Users › Accounts shows the number of accounts, accounts active in 30 days and members. Sort by Health ascending to get the at-risk list, and by Members to find accounts with one active person. Health is 0–100 with the three-part split described above.
- Check retention at account level. In All-platform analytics › Behavior › Behavior analysis, switch identity to account and open the retention view to read cohort retention of accounts, and use lifecycle inactivity buckets (7, 14, 30, 60, 90 days) as an early warning.
- Define the groups you want to watch. All-platform analytics › Users › Segments & tags lets you save a rule such as "did the key event in the last 30 days" and apply it as a cohort in funnels and retention.
- Know the boundary. TapCub does not hold contracts, renewal dates or ARR, and is not a CRM, so GRR, NRR and the renewal-date list stay in your billing system or spreadsheet; it also does not run NPS surveys. TapCub supplies the usage side of the dashboard.
FAQ
What are customer success KPIs?
They are the numbers a customer success team uses to judge whether customers are getting value and will stay. They split into outcome KPIs, such as churn and net revenue retention, and leading KPIs, such as active accounts, active members, time to first value and health score. Review leading ones weekly and outcome ones quarterly.
Which customer success KPIs are leading and which are lagging?
Churn, gross revenue retention, net revenue retention and renewal rate are lagging: they are known after the renewal decision. Active-account rate, active members per account, time to first value, feature adoption and health score are leading: they move weeks or months earlier and let you act.
What should a customer success dashboard include?
Six numbers are enough to start: share of accounts active in 30 days, accounts per health band, median active members per account, median time to first value, GRR and NRR, and an at-risk list with renewal dates. Mark which come from usage data and which from billing or CRM.
How do you track customer retention KPIs?
Use cohorts: group accounts by the month they started and measure how many are still active after 1, 3 and 6 months. Read the shape of the curve, and add inactivity counts for 14, 30 and 60 days as an early warning. Keep revenue retention separate, from billing data.
Is a high health score always a good sign?
No. A health score measures the share of members who are active, so an account with one very active person can score above a larger account with several active ones. Read it together with member count and backtest it against accounts that churned.
Sources
- SecureWorks Corp. Form 10-K for fiscal year 2024. Defines net revenue retention as a comparison of a cohort's recurring revenue at the start and end of a period. Definition wording confirmed on 2026-11-17.
- Frederick F. Reichheld. The One Number You Need to Grow. Harvard Business Review, December 2003, on the Net Promoter Score (promoters minus detractors). Record checked 2026-11-17.
Was this article helpful?
We use your answers to fix and expand this page.
Couldn’t send. Please try again in a minute.
Thanks for the feedback. We’ll use it to improve this page.You’ve already sent feedback on this page. Thanks.

Product Adoption Consultant
Explores customer onboarding, live conversations, and self-service, turning common usage questions into practical guidance and improvements.