Try it on your own data
Every report in this article is in the free plan. One snippet for web and apps, up to 10 sites.
Start freeA data migration project succeeds or fails on the inventory before the move and the reconciliation after it, not on the copying itself. Plan five phases (inventory, design, trial, cutover, reconcile), end each with a number you can recompute, and do not switch while any difference is unexplained.
What you will learn
- Inventory before, reconcile after: copying data is the easy part, and you cannot prove what arrived if you never counted what you had
- Every difference must be explained row by row: in the sample, 1,388 missing rows split into 1,102 bad timestamps and 286 duplicates, so unexplained difference = 0
- Write rollback conditions before cutover, for example rejected rows above 0.5% of the data (6,241 of 1,248,300) or any unexplained difference
What a data migration project is, and what it is not
A data migration project moves data from an old system to a new one. It includes more than copying: you select the data, prepare it, extract it, transform it, load it, check it and then retire the old system. That last part is what separates migration from integration. Migration is a one-off project that ends with the source decommissioned; integration is an ongoing flow between systems that both stay alive.
Projects fall into four kinds, and the kind decides how much transformation to expect:
- Storage migration: moving data between physical media, usually without changing its format.
- Database migration: changing database vendor or upgrading, which may need the data reshaped.
- Application migration: replacing an application such as a CRM or an analytics tool, which usually needs substantial transformation.
- Business process migration: moving data because the business changed, such as after a merger. It is the hardest because it affects how people work.
This guide is a general method that fits all four. If your specific project is moving from Google Analytics 4 to another tool, the GA4 migration checklist covers the details of that case.
Its thesis is simple: a migration succeeds or fails on the inventory before it and the reconciliation after it, not on the move itself. Copying data is the easy part. The projects that go wrong are the ones that never counted what they had, so they cannot prove what arrived. Every phase below ends with a number you can recompute, and the rule at every gate is the same: if the numbers do not match and you cannot explain the difference, you do not switch.
The five phases at a glance
Sources describe three, seven or eight steps for the same work, depending on how finely they cut it. Five phases are enough to plan with, and each has a gate you must pass before the next one starts. The table gives the question each phase answers, what it produces and the gate.
Notice that two of the five phases, the inventory and the reconciliation, contain no data movement at all. They are where most of the risk is removed. For what data quality problems to look for in the inventory, see data quality, and for how the pieces fit if the new system also receives a feed, data pipeline.
| Phase | Question it answers | Output | Gate to pass |
|---|---|---|---|
| 1. Inventory | What do we have, who uses it, and what will we not move? | A sheet with owner, baseline count, key fields and a keep or drop decision per dataset | Every dataset has a baseline and a decision |
| 2. Design | How does each field map, what is rejected and when do we stop? | Mapping, reject rules, tolerance and rollback conditions | Agreed in writing |
| 3. Trial | Does the process work on production-like data? | Two trial runs, each with a reconciliation report | Second trial: unexplained difference 0; key reports match |
| 4. Cutover | Can we switch safely? | Final load, reconciliation, switch | No rollback condition hit within 24 hours |
| 5. Reconcile | Did everything arrive, and does it still agree? | Final report and a retirement date for the old system | Two weeks without a discrepancy |
Sources cut the same work into three, seven or eight steps; what matters is a gate after each phase.
Phase 1: Take inventory
Write down what exists before you decide what to move. For each table, file or report the old system holds, record:
- Name and owner. Who can answer questions about it.
- Row count and size, with a timestamp. This is your baseline. Write the date and time next to it, because the source keeps changing.
- Key fields. The identifier that makes a record unique, and the date field that places it in time.
- Quality problems. Duplicates, empty values in required fields, impossible dates. Count them now, not after the move.
- Consumers. Which reports, dashboards or people depend on it. If nobody depends on a table, ask whether to move it at all.
- Sensitivity and retention. Whether it holds personal data and how long you are allowed to keep it. A migration is a good moment to delete what you should not hold.
The output is a sheet with one row per dataset. Decide here what you will not migrate, and why. Moving only what is used shrinks every later phase.
Phase 2: Design the move
Design answers how, and it should settle three things on paper before any data moves:
- Mapping. For every field, where it goes in the new system, and what changes on the way, such as date formats, units, currency and status codes.
- Reject rules. What happens to a record that cannot be loaded, for example a timestamp that is not a date. Rejected rows go to a file with the reason, not into the void, so every missing record can be explained later.
- Tolerance and rollback conditions. The numbers that would stop the cutover, agreed in advance. See the cutover section for a sample.
Then choose a cutover strategy. Google Cloud's guidance on migrations says to choose your downtime tolerance early, because near-zero downtime takes far more work than a window with downtime.
| Strategy | How it works | Good when | Main risk |
|---|---|---|---|
| Big bang | Stop the old system, load everything, start the new one | Small data and a short downtime is acceptable | One shot; hard to recover if something is wrong |
| Phased | Move one dataset or one group of users at a time | Data splits cleanly into independent parts | Two systems must coexist; links between parts can break |
| Parallel run | Run old and new side by side and compare | You need proof that the new system gives the same answers | Double work; two systems can both be written to by mistake |
The common pitfall is clients that write to both systems at once, which makes the two diverge in ways that are hard to repair. Decide which system is the one that takes writes at each moment, and make that rule visible.
Phase 3: Run a trial migration
A trial migration is the full process run on a copy of production data, with the goal of failing early. Plan at least two rounds. The first finds the problems in your mapping and reject rules. The second shows that your fixes work. Google Cloud's guidance recommends test instances loaded with production-like data and repeated testing before go-live.
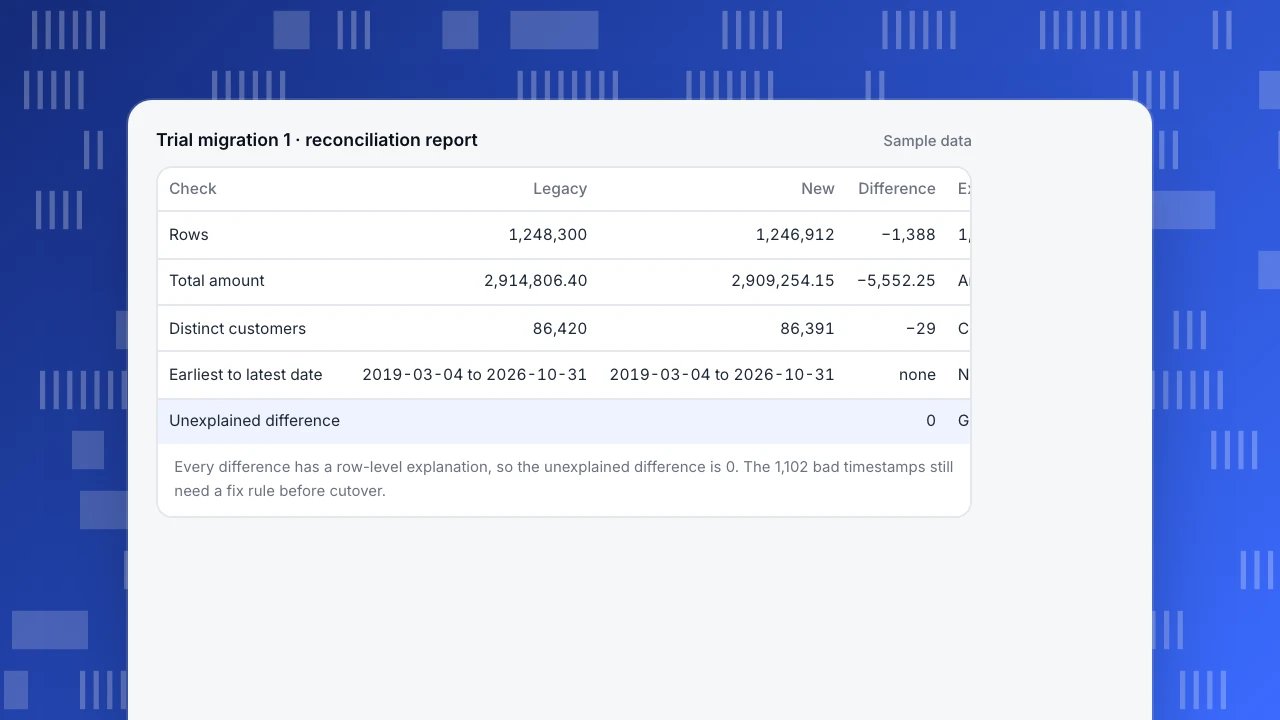
After each round produce a reconciliation report using the checks in the next section. Sample data from the first trial of a 1,248,300-row dataset: 1,246,912 rows loaded and 1,388 rejected, 1,102 for an invalid timestamp and 286 for duplicate keys. Check the arithmetic: 1,248,300 − 1,102 − 286 = 1,246,912. The rejected rows are 1,388 ÷ 1,248,300 = 0.11% of the data. Every missing row has a reason, but 0.11% still needs a fix rule before the cutover: either correct the timestamps or agree that dropping them is acceptable.
Also test what people do with the data, not only the data itself. Run the five reports people open most in both systems and compare the results. Google Cloud's guidance says testing should cover the business logic that clients depend on, not only the data.
The reconciliation checks
Reconciliation proves what arrived. Run the same set of checks after every trial and after the cutover, on both the old and the new side, and put them side by side:
- Row counts per dataset. The simplest check, and the one most often the only one done.
- Distinct keys. The count of unique identifiers, such as customers or orders. It catches duplicates that a row count hides.
- Totals. The sum of any field that carries value, such as amounts, quantities or durations.
- Date range. The earliest and latest date. It catches timezone shifts and truncated loads.
- Null rates. The share of empty values in key fields.
- A sample comparison. Pick 50 records at random and compare them field by field by eye.
The rule that makes this work: every difference must be explained, row by row, and the unexplained difference must be zero. A difference is not acceptable because it is small. In the sample report, the row count differs by −1,388 and the explanation is the 1,102 invalid timestamps and 286 duplicates. The amount total differs by −5,552.25, which equals the amounts on the rejected rows (4,100.00 + 1,452.25). The distinct customers differ by −29, which equals the customers whose only rows were rejected (86,420 − 86,391 = 29). Everything adds up, so the unexplained difference is 0 and the gate passes.
If instead the amount total had differed by −5,552.25 with no rejected rows to account for it, the number would be unexplained and the answer would be to stop. Direct comparison between source and target is not always reliable when you filter or transform the data on the way, which is why you compare totals that you can explain, not just look for equality.
Trial migration 1 · reconciliation report
Sample data| Check | Legacy | New | Difference | Explained by |
|---|---|---|---|---|
| Rows | 1,248,300 | 1,246,912 | −1,388 | 1,102 invalid timestamps + 286 duplicates |
| Total amount | 2,914,806.40 | 2,909,254.15 | −5,552.25 | Amounts on the 1,388 rejected rows |
| Distinct customers | 86,420 | 86,391 | −29 | Customers whose only rows were rejected |
| Earliest to latest date | 2019-03-04 to 2026-10-31 | 2019-03-04 to 2026-10-31 | none | Not applicable |
| Unexplained difference | 0 | Gate passed |
Every difference has a row-level explanation, so the unexplained difference is 0. The 1,102 bad timestamps still need a fix rule before cutover.
Cutover and the conditions for rolling back
The cutover is the moment the new system becomes the one people use. A safe cutover has a fixed order: stop writes to the old system, load the final changes, run the reconciliation checks, test basic functionality in the new system, and only then switch the readers and writers. Back up the new system's initial state first, so you can reset it.
Write the rollback conditions before the cutover, not during it. A sample set, with the thresholds agreed in advance:
- Any unexplained difference in row counts, distinct keys or value totals: do not switch, or roll back if already switched.
- Rejected rows above 0.5% of the data (6,241 rows for 1,248,300): stop and fix the rule.
- A key report differs by more than 0.1% from the old system without an explanation.
- The slowest queries are more than twice as slow as in the old system.
- Anyone has written to both systems.
Rolling back before the cutover is easy: abort and reset the target while the old system keeps running. After the cutover, Google Cloud's guidance treats a rollback as a reverse migration, which needs the same planning and testing as the forward one. That is why you keep the old system, read-only, for a fixed period after the switch, and why the new system must keep individual records rather than only totals if you want the option of going back.
A sample eight-week timeline
Sample data: a plan for a mid-sized dataset with one owner per dataset. Durations depend on data volume and how many reports depend on it.
| Weeks | Work | Gate to pass |
|---|---|---|
| 1 to 2 | Inventory | Every dataset has an owner, a baseline count and a keep or drop decision |
| 3 | Design | Mapping, reject rules, tolerance and rollback conditions agreed in writing |
| 4 to 5 | Trial migrations 1 and 2 | Trial 2 reconciles with unexplained difference zero; the five key reports match |
| 6 | Cutover | Reconciliation within 24 hours of the final load; no rollback condition hit |
| 7 to 8 | Parallel run and read-only old system | Two weeks with no discrepancy; a dated plan to retire the old system |
Keep the old data read-only for at least a month after the switch. For a smaller dataset the whole plan can shrink to two or three weeks; what must not shrink is that each gate is passed before the next phase starts.
Common mistakes
- One big switch with no trial. If the first full run is the real one, every surprise happens in production.
- Reconciling only row counts. Equal counts can hide wrong values or swapped records. Add distinct keys, totals and a sample.
- Letting the source change during extraction. Without a freeze point or a record of changes, the copy will never match.
- Throwing away the old data on switch day. Keep it read-only so you can compare and, if needed, go back.
- Migrating everything. Data nobody uses is cost and risk. The inventory should end with a "do not migrate" list.
- Leaving rejected rows with no owner. A reject file nobody reads is a silent data loss.
- Never testing the rollback. A rollback plan that was never run is a hope, not a plan.
Running the same plan for a web analytics migration in TapCub
Moving your web analytics to TapCub is this project in miniature. TapCub is not a tool for migrating your own databases; what follows is the plan applied to analytics.
- Inventory what people use. List the goals, funnels and reports someone opens every week; there are usually fewer than ten. TapCub's help page on migrating goals maps each kind of conversion in your current tool to a page goal, an event goal, a funnel or a segment, and notes that TapCub's goal conversion rate divides by distinct visitors, not sessions, so rates look different even when counts match. See move goals from GA4.
- Trial in parallel. Add the TapCub snippet next to the existing tag for a week and compare definitions rather than raw totals: write down the ratio each day. The migration guide lays out the one-week plan, from day 1 to the switch on day 7, keeping the old tag for another month.
- Check the new side. In All-platform analytics › Data › Tracking plan, list the events you intend to collect with their required properties; the live validation view for the last 24 hours shows each event's arrival count and how complete the required properties are. That is your reconciliation report for the new side.
- Bring your own history, if you must. TapCub does not import GA4 history, because the two tools count users and sessions differently and one chart would mix incompatible definitions; keep read access to the old property instead (see import GA4 history). For your own data, All-platform analytics › Data › Data import takes a CSV of events, a CSV of user attributes or Nginx and Apache access logs, up to 100,000 rows per file. You preview and map columns first, then the result shows total, imported and failed rows, so total = imported + failed is your row-count check. Imported events carry platform=import, so you can filter them with the platform dimension; visitors from log files are not merged with visitors from the script. Sending history through the server interface does not preserve dates: events more than 72 hours away from server time are rewritten to the time they were received.
- Switch, then keep the old tool. Make TapCub the link people open, and keep the old tag and read access for the fallback month.
FAQ
What are the phases of a data migration project?
Five are enough to plan with: inventory, design, trial migration, cutover and reconciliation. Some guides list three phases (plan, migrate, post-migrate) or seven or eight steps. They describe the same work at different levels of detail. What matters is a gate after each one, so you do not start the next phase until the numbers match.
How do you validate migrated data?
Compare the old and new side with the same checks: row counts, distinct keys, totals of value fields, date ranges, null rates and a sample of records compared field by field. Every difference needs a row-level explanation, and the unexplained difference must be zero before you switch.
What is the difference between a big bang and a phased migration?
A big bang moves everything in one cutover window and is simplest when the data is small and a short downtime is acceptable. A phased migration moves one dataset or group at a time, which lowers the risk of each step but means two systems must coexist for a while.
How long does a data migration project take?
It depends on data volume, transformation and how many reports depend on the data. A mid-sized project in the sample takes about eight weeks with two trial runs and a two-week parallel run. A small dataset can take two or three weeks, as long as each gate is still passed.
When should you roll back a migration?
When any condition you agreed in advance is hit: an unexplained difference in counts or totals, rejected rows above your tolerance, a key report that differs without explanation, or queries much slower than before. Write these conditions down before the cutover, and keep the old system read-only so rolling back remains possible.
See also: What is data conversion? Types, checks and a time zone example.
Sources
- Wikipedia, Data migration (definition, categories, phases, parallel run). Checked 2026-11-17.
- Google Cloud, Database migration: Concepts and principles (Part 1) (downtime tolerance, verification, cutover, fallback). Checked 2026-11-17.
- Google Cloud, Database migration: Concepts and principles (Part 2) (validation, dry runs, fallback as reverse migration). Checked 2026-11-17.
Was this article helpful?
We use your answers to fix and expand this page.
Couldn’t send. Please try again in a minute.
Thanks for the feedback. We’ll use it to improve this page.You’ve already sent feedback on this page. Thanks.

Technical Engineer
Focuses on tracking code, SDKs, and API integrations, with practical guidance on implementation checks and troubleshooting.