Try it on your own data
Every report in this article is in the free plan. One snippet for web and apps, up to 10 sites.
Start freeDigital marketing reporting is a recurring document that tells the people who fund marketing where the money went, what it brought back and what to change next. The reports that get read keep to one rule: one row per channel, and every row uses the same denominator, usually sessions and orders. Below: a six-part template, a four-channel table you can recompute and a definitions note.
What you will learn
- A report answers three questions: where the money went, what it brought back, what to change
- One row per channel on the same denominator (sessions and orders), taken from one data source
- Write a short definitions note and lead with a one-line headline plus the decision needed
What is digital marketing reporting?
Digital marketing reporting is a recurring document that tells the people who fund or run marketing three things: where the money went, what it brought back, and what to change next. Everything else in a report, including the charts, is there to support one of those three answers.
A report is not a dashboard. A dashboard is a screen you check when you want; a report is a snapshot with an author, a period and a conclusion that someone reads on a schedule. For the always-on screen, see marketing dashboard. This guide is about the document: what goes in it, how to make the channels comparable, and how often to send it.
The rule that keeps reports honest: one row per channel, and every row uses the same denominator. If paid search is measured in clicks, email in opens and social in impressions, each channel looks good on its own terms and nobody can compare them. Sessions and orders are the two denominators most sites can agree on.
What should a digital marketing report contain?
Six parts cover almost every audience. Keep each to the length shown, because a report nobody finishes reading changes nothing.
- Summary (3 sentences). Spend, result and the one thing that changed. If the reader stops here, they should still know the decision.
- Scorecard (one table). The same four to six numbers for every channel: spend, sessions, orders, revenue, cost per order, return on spend.
- Changes versus the last period. Only numbers that moved by more than a threshold you set are worth explaining, each with one reason.
- What we did. Launches, budget moves, tests and fixes, in one line each, so the reader can connect actions to numbers.
- Next steps and decisions needed. Name an owner and a date, and say which decisions need the reader.
- Definitions note. Period, time zone, attribution rule, denominators and spend scope (see below). It is short and it prevents most arguments.
The most common failure is a report that is all part 2: a wall of numbers with no summary, no decision and no definitions.
Worked example: four channels in one table
Sample data: one month for an online store. Spend includes ad cost for paid channels, the email tool for email and the content and SEO retainer for organic search. Orders and revenue are from the store's own order records, one channel per order.
| Channel | Spend | Sessions | Orders | Revenue | Cost per order | Return on spend | Conversion rate |
|---|---|---|---|---|---|---|---|
| Paid search | $6,000 | 12,000 | 240 | $19,200 | $25.00 | 3.20 | 2.00% |
| Paid social | $4,000 | 10,000 | 80 | $5,600 | $50.00 | 1.40 | 0.80% |
| $500 | 6,000 | 150 | $9,000 | $3.33 | 18.00 | 2.50% | |
| Organic search | $3,500 | 30,000 | 300 | $21,000 | $11.67 | 6.00 | 1.00% |
| Total | $14,000 | 58,000 | 770 | $54,800 | $18.18 | 3.91 | 1.33% |
How to recompute: cost per order = spend ÷ orders (6,000 ÷ 240 = $25.00); return on spend = revenue ÷ spend (19,200 ÷ 6,000 = 3.20); conversion rate = orders ÷ sessions (240 ÷ 12,000 = 2.00%). Totals are sums, then the same formulas: 14,000 ÷ 770 = $18.18 and 54,800 ÷ 14,000 = 3.91. Because each order belongs to one channel, the four order counts add to 770 with nothing counted twice.
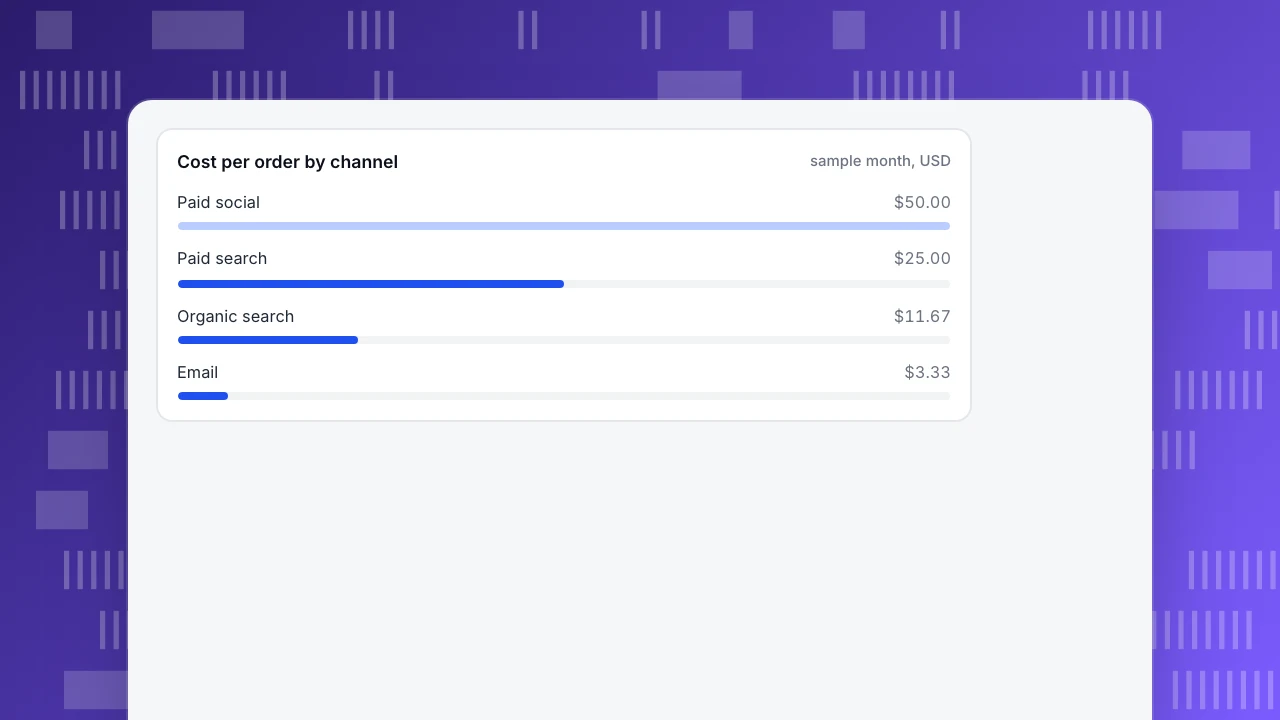
Three readings the table supports. Paid social costs twice as much per order as paid search ($50.00 versus $25.00). Email's return looks extraordinary at 18.00, but it sells to people who already know the store and its cost is tiny, so it cannot absorb more budget the way a paid channel can. Organic search brings half of all sessions (30,000 of 58,000, 51.7%) and 39.0% of orders (300 of 770).
The same-denominator rule matters most when someone brings a platform's own numbers. Suppose the paid social platform reports 140 conversions for the month. At $4,000 that is $28.57 per conversion, against $50.00 per order in the table. The platform and the store count different things, for example under different attribution windows. Neither is "wrong", but a report that mixes them has no stable meaning, so pick one source (here, the order records) for every row and say so in the definitions note.
Finally, show change, not just level. Suppose paid social had 100 orders last month on the same $4,000: cost per order was $40.00 and is now $50.00, up 25%. That single line, with a reason (a creative change on the 9th, for instance), is the report's real content.
Cost per order by channel
sample month, USDHow do you write the definitions note?
The definitions note is three to six lines under the scorecard. It turns "the numbers changed" into "the numbers changed, and the method did not". A usable version:
- Period: calendar month, in the site's time zone.
- Orders and revenue: the store's order records, one channel per order, refunds not netted.
- Channel rule: the channel is set from the UTM tags and referrer at the start of the session.
- Spend: invoices for ad platforms, the tool subscription for email, the retainer for organic search; staff time excluded.
- Not shown: view-through conversions and platform-reported numbers.
Channel attribution is only as clean as the tags. In Google Analytics, for example, UTM values are case sensitive, so Google and google are counted as two sources (Google). A naming rule for utm_source, utm_medium and utm_campaign, written once and followed by everyone who builds a link, is the cheapest data-quality fix in marketing. See UTM for the parameters.
Return on spend divides revenue by cost; Google Ads describes the same ratio as a multiple of ad spend in its target ROAS example (5 dollars of sales per dollar of ad spend is 500%). Write the denominator you used, because some teams include only ad cost and some include all marketing cost; the difference is explained in ROI and ROAS and marketing ROI.
How often should you report, and to whom?
The right rhythm depends on how fast a decision can be changed. A weekly report to the person who can move a budget is useful; the same report to a board is noise.
| Rhythm | Reader | Length | What it answers |
|---|---|---|---|
| Weekly | Channel owner, team lead | One page | Did anything break or jump? What do we adjust this week? |
| Monthly | Head of marketing, finance, clients | Two pages | What did we spend and get, and what changes next month? |
| Quarterly | Leadership | Short deck | Are we investing in the right channels, and is the mix working? |
A practical rule: weekly reports contain only changes and exceptions, monthly reports contain the scorecard and the decisions, and quarterly reports contain the trend of the monthly scorecard. If the monthly report is just the four weekly reports stapled together, nobody reads either. Automating the recurring part is covered in automated reports; a general reporting format for site traffic is in web analytics report.
| Rhythm | Reader | Length | What it answers |
|---|---|---|---|
| Weekly | Channel owner, team lead | One page | Did anything break or jump? What do we adjust this week? |
| Monthly | Head of marketing, finance, clients | Two pages | What did we spend and get, and what changes next month? |
| Quarterly | Leadership | Short deck | Are we investing in the right channels, and is the mix working? |
Weekly reports carry changes and exceptions; monthly reports carry the scorecard and decisions; quarterly reports carry the trend.
What do good marketing report examples look like?
Three formats are enough for most teams. Each is a skeleton you can fill in, and the headlines below are sample text.
- Weekly channel report. Headline: "Paid social cost per order rose to $50.00 (+25%)". Then the scorecard, the three biggest movers, and one action for the week.
- Monthly leadership report. Headline: "$14,000 spent, 770 orders, $54,800 revenue; blended cost per order $18.18". Then the table, the changes, decisions needed and the definitions note.
- Campaign post-mortem. Headline: "Spring sale: 1,200 orders, return on spend 4.1". Then goal, audience, spend, result, what to repeat and what to drop, one page.
What they share is the headline. A reader who sees only the first line should know whether to be worried, and the rest of the document is the evidence for that line.
Common mistakes in digital marketing reports
- Each channel graded on its own metric. Clicks, opens and impressions cannot be compared; put every channel on sessions and orders.
- Mixing sources for the same number. Platform conversions in one row and order records in another make cost per order meaningless, as the $28.57 versus $50.00 gap showed.
- No definitions note. When the method changes quietly, the trend breaks and nobody knows why.
- Level without change. "Cost per order is $50.00" says little; "$50.00, up from $40.00" starts a conversation.
- Treating owned channels like paid ones. Email's return of 18.00 does not mean spending more on email will do the same.
- A report with no decision. If the last section is empty, ask whether the report needs to be sent.
How to build this report in TapCub
Here is how the store above would produce the monthly table in TapCub. TapCub measures and shows the table; it does not buy ads or move budget, and the report document itself is yours to write.
- Tag the links and check the channels. Use consistent UTM tags, then open Web analytics › Sources to see sessions by channel, source and UTM parameter. Channel rules can be configured, so a source that lands in the wrong channel can be fixed once.
- Import the spend. In All-platform analytics › Business › Channel ROI, open the Costs tab and add spend by hand or import a CSV with
day,channel,source,campaign,cost,currency,clicksandimpressions. Onlydayandcostare required, and re-importing the same day, channel, source and campaign overwrites the row. - Read the ROI tab. TapCub shows cost per click (spend ÷ sessions), cost per acquisition (spend ÷ purchases on the order ledger) and return on ad spend (revenue ÷ spend), grouped by channel, source or campaign. Note that its cost per click divides by sessions, not by ad clicks, and that purchases must be on the order ledger or revenue stays zero.
- Mark what you did. Add annotations for launches and budget changes under Configuration › Annotations, so a jump on a chart has a reason next to it.
- Send the traffic part automatically. Under Configuration › Settings › Notifications, a weekly or monthly scheduled report sends visitors, sessions, bounce rate and average duration with period change, plus the fastest-rising pages and sources and conversions for enabled goals. It does not include the spend table, so for the channel table, copy the numbers into your document. A public sharing link can show overview, sources and other web modules read-only, with an optional password.
The scheduled report needs a plan that includes it. TapCub does not write the narrative for the spend table; that remains your summary and decisions.
FAQ
What should a digital marketing report include?
A short summary, a scorecard with the same numbers for every channel (spend, sessions, orders, revenue, cost per order, return on spend), the changes versus last period with one reason each, actions taken, next steps and decisions needed, and a definitions note. If the reader can name the decision after the first paragraph, the report is working.
How do you write a marketing report for a client or your boss?
Lead with one sentence: what was spent, what came back and the one change that matters. Then show the scorecard, explain only what moved, and end with what you need from them. Add the definitions note so they can trust the numbers without asking how each was calculated.
How often should you send marketing reports?
Weekly to the person who can adjust budgets, monthly to leadership, finance or clients, and quarterly for the trend. Weekly reports should show only changes and exceptions. A monthly report that is four weekly reports stapled together is usually not read.
What is the difference between a marketing report and a dashboard?
A dashboard is a live screen for checking numbers whenever you like. A report is a dated snapshot with a conclusion and recommended actions, written for a reader who will not open the dashboard. Many teams use a dashboard as the source and a short report as the explanation.
What are good examples of marketing reports?
Three common ones: a weekly channel report that shows changes and one action, a monthly leadership report with the channel table and decisions needed, and a campaign post-mortem that covers goal, spend, result and what to repeat. Each starts with a one-line headline that carries the conclusion.
See also: Analytics for Agencies: Structure Multi-Client Reporting That Scales.
Sources
- Google Analytics Help. Collect campaign data with custom URLs. UTM parameters and their case sensitivity.
- Google Ads Help. About Target ROAS bidding. Return on ad spend as conversion value relative to cost, with the 5-dollars-per-dollar example.
- Google Ads Help. About conversion measurement. Conversions are the customer actions you define as important, such as purchases and sign-ups.
Was this article helpful?
We use your answers to fix and expand this page.
Couldn’t send. Please try again in a minute.
Thanks for the feedback. We’ll use it to improve this page.You’ve already sent feedback on this page. Thanks.

Product Experience Specialist
Explores usability, user journeys, and feature adoption through practical examples of onboarding and everyday product use.