Try it on your own data
Every report in this article is in the free plan. One snippet for web and apps, up to 10 sites.
Start freeAnalytics reporting is the recurring write-up that turns numbers into something a reader can act on. A good report is accountable for a decision: it opens with a one-sentence conclusion, shows the few figures that support it and ends with actions that have owners and dates. Below: the structure, a worked example that splits an 11.0% drop into two causes, templates by cadence, caveat rules and how to set it up in TapCub.
What you will learn
- Open with the conclusion and a number; the reader should be able to stop after two lines and still know what to do
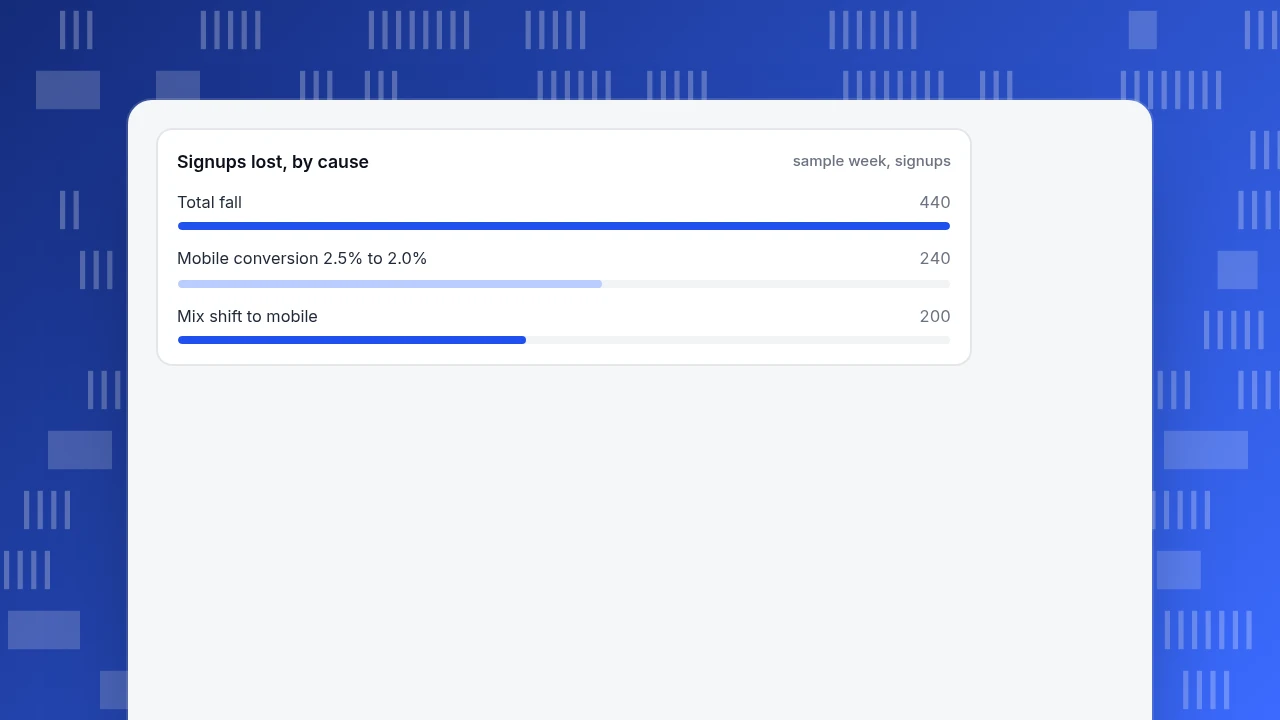
- Split a change into mix and rate effects before explaining it; in the example 200 of 440 lost signups were only a shift in traffic
- Every action needs an owner and a date, and every caveat needs a note on whether it changes the action
What is analytics reporting, and what is it for?
Analytics reporting is the recurring write-up that turns tracked numbers into a statement someone can act on. A dashboard shows what is happening; an analytics report says what changed, why it probably changed, and what the reader should do about it. Two reports can use identical data and be worth very different amounts, because one stops at the numbers and the other finishes the job.
A useful test is to read the first two lines of your report as if you were the person who has to decide. If you cannot tell what is being asked of you, it is a data dump. People who open reports are scanning for the point, and Nielsen Norman Group's guidance on writing for scanners says to lead with the conclusion so the reader can stop at any point and still have the main idea.
That gives the standard this guide uses: a report is accountable for a decision, so it states a conclusion, shows the evidence and lists an action. Dashboards and live views are a different tool; see automated reports for how scheduled delivery works and web analytics report for what a website report covers.
The three-part structure: conclusion, evidence, action
Put the sections in this order, because it is the order the reader needs them.
| Section | Question it answers | Length | Example line |
|---|---|---|---|
| Conclusion | What happened, in one sentence with a number? | 1–2 sentences | "Signups fell 11.0% week on week, mostly on mobile." |
| Evidence | Why do we believe that? | 3–5 numbers and one chart or table | Sessions, signup rate, and the split by device |
| Action | What should someone do, by when? | 1–3 bullets with an owner | "Mobile team to check the form release from Tuesday; update Friday." |
| Caveats | What might make this wrong? | 1–3 bullets | "Tracking changed on the 12th; bots excluded in both weeks." |
Three rules keep the structure honest:
- One conclusion per report. If you have three, write three reports or rank them and lead with the one that has the largest money or user impact.
- Every number has a comparison. "3,560 signups" means nothing; "3,560, down from 4,000" does.
- Every action has an owner and a date. Without both it is a wish.
| Section | Question it answers | Length |
|---|---|---|
| Conclusion | What happened, in one sentence with a number? | 1–2 sentences |
| Evidence | Why do we believe that? | 3–5 numbers and one chart or table |
| Action | What should someone do, by when? | 1–3 bullets with an owner |
| Caveats | What might make this wrong? | 1–3 bullets |
Keep the order fixed so readers find the answer in seconds.
A worked example: from dashboard to report
Sample data: a product team reviews signups every Monday. The dashboard shows 4,000 signups last week and 3,560 this week.
What the dashboard shows
| Week | Sessions | Signup rate | Signups |
|---|---|---|---|
| Last week | 100,000 | 4.00% | 4,000 |
| This week | 100,000 | 3.56% | 3,560 |
Signups fell by 440, or 440 ÷ 4,000 = 11.0%. A weak report stops here and adds "investigate."
What the report adds: split by device
| Device | Last week sessions | Last week rate | Last week signups | This week sessions | This week rate | This week signups |
|---|---|---|---|---|---|---|
| Desktop | 60,000 | 5.0% | 3,000 | 52,000 | 5.0% | 2,600 |
| Mobile | 40,000 | 2.5% | 1,000 | 48,000 | 2.0% | 960 |
| All | 100,000 | 4.00% | 4,000 | 100,000 | 3.56% | 3,560 |
Two things happened at once, and you can separate them:
- Mix shift. Mobile rose from 40% to 48% of sessions. At last week's rates this week's mix would give 52,000 × 5.0% + 48,000 × 2.5% = 2,600 + 1,200 = 3,800 signups, so the shift alone cost 4,000 − 3,800 = 200.
- A real mobile drop. Mobile conversion fell from 2.5% to 2.0%: 48,000 × 2.0% = 960 against 1,200 expected, a loss of 240.
200 + 240 = 440, so the explanation accounts for the whole gap. Desktop conversion did not move.
The report, written for the decision
Conclusion. Signups fell 11.0% (4,000 to 3,560). Of the 440 lost, 240 come from mobile conversion dropping from 2.5% to 2.0%; 200 come from mobile's share of sessions rising from 40% to 48%. Evidence. Desktop rate unchanged at 5.0%. Mobile sessions +20%, mobile rate −0.5 points. Action. Mobile team to check Tuesday's signup form release and report by Friday. Marketing to check which channel brought the extra mobile sessions. Caveat. One week of data; the mix effect may be a campaign that ends.
That is short enough for a manager to read in a minute and act on.
Signups lost, by cause
sample week, signupsHow to choose the numbers and comparisons
A report with twenty numbers hides the one that matters. Choose by role.
| Number type | Count | Compare against | When it misleads |
|---|---|---|---|
| Outcome (signups, orders, revenue) | 1–2 | Previous period and same period last year | Seasonal swings, one-off campaigns |
| Driver (traffic, conversion rate) | 2–3 | Previous period | A rate can fall because the mix changed, as above |
| Segment (device, channel, country) | 1 split | Same segment last period | Small segments with a few hundred visits swing wildly |
| Quality (errors, bounce rate) | 1–2 | A set threshold | Tracking changes can move them without any user change |
Pick the comparison that fits the question. Week on week suits fast-moving things; same week last year suits anything seasonal. When both are available, show one and mention the other only if they disagree. For turning these numbers into a narrative, see data storytelling.
Report templates by cadence
Match length and depth to how often the report arrives and who reads it.
| Cadence | Reader | Length | Contents |
|---|---|---|---|
| Weekly | The team that can act | One screen | Conclusion, 3–5 numbers, one action list |
| Monthly | Department lead | One to two pages | Conclusion, trend of the outcome, driver table, segment cut, actions |
| Quarterly | Leadership | Two to three pages | Result against plan, two or three causes, decisions requested, risks |
Keep the template fixed. A fixed order lets the reader find the answer in seconds, and a fixed set of numbers lets them see change from one report to the next without relearning the layout.
A fixed template also makes review easier. Once a quarter, read the last four reports side by side and ask three questions: which actions were completed, which conclusions turned out right, and which numbers nobody used. Drop the numbers nobody used and add one for any decision that had no number behind it. A report that is never pruned grows by a few figures every month until the conclusion is buried again, which is the problem the structure was meant to prevent.
Say what might make the report wrong
A caveat is not an apology; it is information the reader needs to weigh the conclusion. Include one when any of these is true:
- Tracking changed. A new script, a renamed event or a consent change can move numbers with no real user change. Note the date.
- The period is incomplete. A week with a data delay, or a month still in progress, is not comparable with a full one.
- Traffic includes non-human visits. Bots and crawlers inflate sessions and deflate conversion rates.
- The sample is small. A segment with 200 sessions and 4 signups can move by 25% on one extra signup.
State the caveat in one line and say whether it would change the action. If it would, the action should be "verify first".
Common mistakes in analytics reports
- Burying the point. Starting with methodology and ending with the finding forces the reader through everything to find what matters.
- Reporting a rate without its numerator and denominator. In the example, the overall signup rate fell partly because of mix; the rate alone hides that.
- Explaining every movement. Report the changes that cross a threshold you set in advance, not every wiggle.
- Actions without owners. "Improve mobile conversion" has no one to do it.
- Changing the template each time. The reader spends the report learning the layout.
- Mixing the audience. A report for the team and a summary for leadership are two documents with different first lines.
How to build this report in TapCub
The Monday signup report above takes four steps in TapCub, and the last one removes the need to build it by hand each week.
- Set up the table. Open Web analytics › Reports, choose the columns you need (visitors, sessions, conversion rate, conversions) and the week bucket. Turn on Show change and pick the previous period or the same period last week. The column choice is stored in the link, so you and your reader see the same table.
- Find what moved. Click the week's row to open Overview for those dates, then use All-platform analytics › Behavior › Behavior analysis to split the signup funnel by device. For "why did it change," the AI assistant in All-platform analytics › Operations › AI Assistant can split a change by channel, source domain, country, device and landing page.
- Mark known causes. Add a date note in Configuration › Annotations for a release or campaign so the next reader of the chart sees it.
- Schedule the numbers. Click Subscribe on the report; it opens the project's notification settings, where daily or weekly delivery is set up.
TapCub delivers and compares the numbers. It does not write the conclusion, the action or the caveat: those are the part of the report that only a person who knows the product can write, and they are what the reader is paying attention for.
FAQ
What is the difference between analytics and reporting?
Reporting presents what happened on a schedule, in a fixed format. Analytics investigates a question: why did it happen and what should we do. A good analytics report combines both, with the routine numbers up top and the investigation behind the conclusion.
What should an analytics report include?
A one-sentence conclusion with a number, three to five supporting figures with comparisons, one or more actions with an owner and a date, and any caveat that could change the conclusion. A chart or table helps when it shows the comparison the conclusion rests on.
How often should you send an analytics report?
Match the cadence to how fast the decision can change. Weekly suits teams that can act on a funnel or campaign within days; monthly suits department leads; quarterly suits leadership reviewing plan against result. Sending more often than anyone can act wastes attention.
How long should an analytics report be?
As short as the decision allows: one screen for a weekly team report, one to two pages monthly, two to three quarterly. Put detail in an appendix or a linked view so the reader opts in.
Should an analytics report include recommendations?
Yes, as actions with an owner and a date. A recommendation is the analyst's judgement about what the evidence implies, so label it as one and keep it separate from the figures. If the evidence is too thin to recommend anything, say that plainly and make the action "collect more data until Friday" rather than inventing certainty.
Sources
- Nielsen Norman Group. Inverted Pyramids in Cyberspace — putting the conclusion first so scanning readers can stop at any point. Verified 2026-11-19.
- Nielsen Norman Group. How Users Read on the Web — people scan rather than read word by word. Verified 2026-11-19.
Was this article helpful?
We use your answers to fix and expand this page.
Couldn’t send. Please try again in a minute.
Thanks for the feedback. We’ll use it to improve this page.You’ve already sent feedback on this page. Thanks.

Customer Experience Consultant
Writes about live chat, visitor conversations, and self-service, sharing practical ways to make customer communication clearer and more effective.