Try it on your own data
Every report in this article is in the free plan. One snippet for web and apps, up to 10 sites.
Start freeAn attribution model is the rule that decides which touchpoints get credit for a conversion: first touch, last touch, linear, position-based, time decay or data-driven. No model is right in general, only for the question you ask. Run the same ten conversions through five models and paid social earns $700 or $0.
What you will learn
- The model sets how credit is split; the same conversions can credit a channel $700 or $0
- Compare several models side by side and read each channel's range, not one number
- Use attribution for where credit lies, and a holdout or incrementality test for what caused the sale
What is an attribution model?
An attribution model is the rule that decides which touchpoints get credit for a conversion. A customer rarely buys after one visit: they find you through a social ad, come back from an email, and finally click a search ad. The model answers "who gets the sale?" for that path. Google's own help pages describe attribution models as a rule, a set of rules, or a data-driven algorithm that assigns credit to touchpoints.
Three terms recur in every model:
- Touchpoint: one visit or interaction that can be credited, such as a session from paid social or from email.
- Conversion: the outcome being shared out: an order, a signup, a trial start.
- Lookback window: how far back from the conversion a touch can still count. A 30-day window ignores a visit 45 days before the purchase.
The point of this guide is simple: the model decides how credit is split, and no model is the right one in general, only the right one for the question you are asking. The same ten conversions can make paid social look like the best channel or a channel worth cutting, depending on the rule. Multi-touch models as a family have their own page, multi-touch attribution, and the broader idea is in what is attribution; this page compares the models and shows how to pick one.
The models side by side
Single-touch models give all credit to one touch. Multi-touch models share it. Data-driven models learn the shares from your data.
| Model | How credit is split | Good for | Blind spot |
|---|---|---|---|
| First touch | 100% to the first touch | Where demand starts; awareness channels | Ignores everything that closed the sale |
| Last touch | 100% to the last touch | Short buying cycles; closing channels | Gives nothing to the channels that started the journey |
| Linear | Equal shares to every touch | Long cycles where every step matters | Treats a brief visit like the decisive one |
| Position-based (U-shaped) | Larger shares to first and last, small share to the middle | Journeys where finding and closing matter most | The split is a convention, not measured |
| Time decay | More credit the closer a touch is to the conversion | Short promotions, limited-time offers | Undervalues early awareness |
| W-shaped | Position-based plus a share for a middle milestone such as lead creation | B2B journeys with a clear lead stage (see B2B marketing attribution) | Needs a reliable milestone event |
| Data-driven | Credit learned from converting and non-converting paths | Large volumes of conversions | Needs volume; hard to inspect |
The rule-based ones are explained one by one in the glossary: last-click, linear and position-based attribution. A touch that helps but never closes is called an assisted conversion.
Google's data-driven attribution, as its help page describes it, compares the ad paths of customers who convert with those who do not and gives more credit to interactions that tend to lead to conversions. Google recommends at least 200 conversions and 2,000 ad interactions in 30 days for best results; the model still works with less, but less precisely.
Same data, five models: a worked example
Sample data: ten conversions of $100 each, four journey types, over a 30-day lookback window. Touches are listed oldest to newest, with the number of days before the purchase in brackets.
| Journey | Conversions | Path (days before purchase) |
|---|---|---|
| A | 4 | Paid social (10) → Paid search (0) |
| B | 3 | Paid social (14) → Email (7) → Paid search (0) |
| C | 2 | Organic search (6) → Email (0) |
| D | 1 | Paid search (0) |
Total revenue is 10 × $100 = $1,000. Credit by channel under each model (every column sums to $1,000):
| Channel | First touch | Last touch | Linear | Position-based | Time decay (7-day half-life) |
|---|---|---|---|---|---|
| Paid social | $700 | $0 | $300 | $320 | $151 |
| Paid search | $100 | $800 | $400 | $420 | $563 |
| $0 | $200 | $200 | $160 | $215 | |
| Organic search | $200 | $0 | $100 | $100 | $71 |
How these were computed, using journey B (3 touches, $100 each, 3 conversions = $300 of revenue) as the example:
- Linear: 1/3 each, so $100 per touch across the 3 conversions: paid social, email and paid search get $100 each.
- Position-based: with more than two touches, the first and last get 40% each and the middle shares 20%: paid social $120, paid search $120, email $60. A two-touch journey (A, C) splits 50/50; a one-touch journey gets everything.
- Time decay: each touch's weight is 2 raised to the power of minus days ÷ 7. For B: paid social at 14 days = 0.25, email at 7 days = 0.5, paid search at 0 days = 1.0. Total 1.75, so the shares are 14.3%, 28.6% and 57.1%.
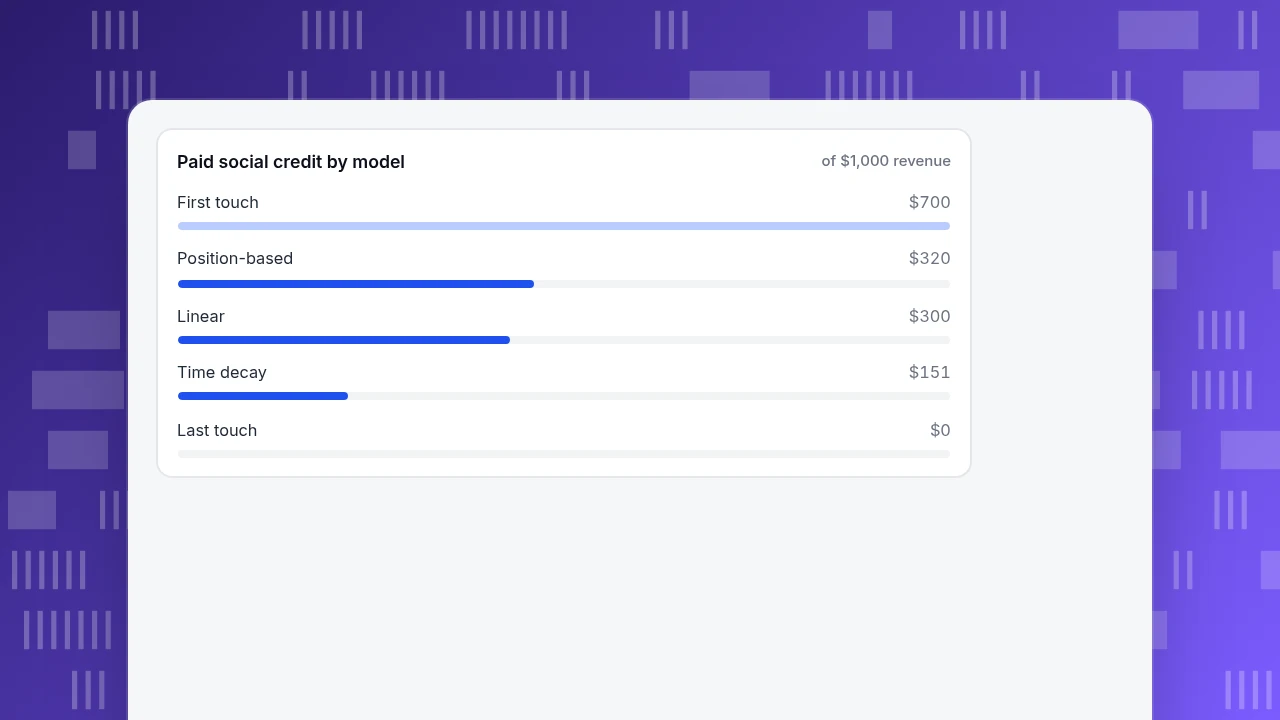
Now read across the first two columns. Paid social gets $700 under first touch and $0 under last touch. Nobody made a mistake: the two models ask different questions. A budget meeting that used only last touch would conclude paid social does nothing; one that used only first touch would conclude paid search does almost nothing. Paid search ranges from $100 to $800, a spread of 8 to 1, depending on the rule.
Paid social credit by model
of $1,000 revenueWhat to read from the comparison
Put the models next to each other and look for three patterns:
- Stable channels. Email gets $160 to $215 under every model except first touch, where it never appears first. A channel with a narrow range is credited about the same however you split.
- Assist-only channels. Paid social gets credit in four of the five models and none under last touch. A big gap between its first-touch and last-touch numbers means it starts journeys that others finish. Cutting it based on last touch would remove the starts.
- Closer channels. Paid search's credit rises as the model favors recency: $100 first touch, $400 linear, $563 time decay, $800 last touch. It is strong at the end of journeys; whether it creates demand or harvests it is something attribution cannot tell you.
A practical reading: take each channel's lowest and highest credit across the models and treat the range as the honest answer. A decision that is right at both ends (keep email) is safe; a decision that only works at one end (cut paid social) needs more evidence than a reshuffled credit table.
How to choose a model
Choose by the question and the shape of the buying cycle:
- If the cycle is one session or a day or two, use last touch. There is little else to credit.
- If the question is "where does new demand come from?", look at first touch, restricted to new visitors.
- If journeys have many touches over weeks and you do not know which matters, use position-based or linear as the default and compare with last touch.
- If you are running a short promotion, add time decay: recent touches really did more of the work.
- If you have hundreds of conversions a month and the platform offers it, test data-driven and compare it with a simple rule rather than replacing it.
- If the decision is "how much to spend", no attribution model is enough alone: use it for the question of where credit lies, and use a holdout or an incrementality test to learn what would not have happened without the spend (incrementality).
Whatever you pick, write the model, the touch type and the lookback window next to every number and compare like with like over time. Changing the window from 30 to 7 days changes the credit table too, so hold it constant.
| Your question | Start with | Why |
|---|---|---|
| Buying cycle is a day or two | Last touch | Little else to credit |
| Where does new demand come from? | First touch, new visitors only | Shows which channels start journeys |
| Long journeys, unknown driver | Position-based or linear, compared with last touch | Spreads credit while you learn |
| Short promotion | Time decay | Recent touches did more of the work |
| Hundreds of conversions a month | Data-driven, compared with a simple rule | Learns shares from your own paths |
| How much to spend | Attribution plus a holdout test | Attribution shares credit; it does not prove cause |
Write the model, touch type and lookback window next to every number.
Google retired four of these models
If you meet an old guide that tells you to pick among first click, linear, time decay and position-based inside Google Ads or Google Analytics 4, it is out of date. Google announced on April 6, 2023 that these four rule-based models would go away; the Ads help page says data-driven attribution, last click and external attribution were not affected, and the Analytics help page says the four were retired in November 2023. The models still work as ideas; you can compute them yourself from your own touchpoint data, as the example above does.
This is a reason to keep your own comparison: platforms change which models they offer and which one is the default, and a number that silently changes definition is a data discrepancy waiting to happen.
Common mistakes
- Treating a model as the truth. A model is a rule for sharing credit. It says what each channel would get under that rule, not what each channel caused.
- Comparing numbers from different models. A 4.0 under last click and a 2.5 under linear are not a trend.
- Using the wrong touch type. Channel, UTM campaign and landing page are different questions; pick one per analysis.
- Ignoring the lookback window. Too short drops the early touches; too long mixes old visits into new conversions.
- Crediting only the paths you can see. Visits without a session on record, or conversions with no touch inside the window, stay unattributed; count them and report the share.
- Cutting an assist-only channel. Check the first-touch and linear numbers before removing a channel with a $0 last-touch score.
How to compare attribution models in TapCub
Take the example above and run it on your own data:
- Open All-platform analytics › Behavior › Behavior analysis and choose the attribution analysis. Set the conversion to a goal: one event or page, written like a funnel step.
- Choose the touch type. It defaults to channel, falling back to the referrer channel when the channel is empty; you can switch to referrer channel, UTM source, UTM campaign, referrer domain or landing page. The lookback window defaults to 30 days (1 to 90) and includes the session of the conversion.
- Select several models at once: first touch, last touch, linear, position (one touch gets all, two touches split in half, more than two give the first and last 40% each and share 20% in the middle) and time decay (half-life 7 days by default, 1 to 90). Each selected model becomes a column, so an assist-only channel shows up as a row with credit in some columns and none in last touch.
- Read the four headline numbers (conversions, attributed conversions, conversions with no touch and average touches), then the table: paths, touch sessions and the touch rate (paths ÷ touch sessions).
Limits to keep in mind: TapCub's attribution uses the sessions before the conversion, not an install postback; it scores at most 50,000 conversions, so above that the unattributed count is inflated; a conversion with no session in the window stays unattributed; and the five models are rule-based, with no data-driven model. TapCub measures credit; it does not run experiments, so use a holdout elsewhere to test incrementality. Spend by channel is on a different page, All-platform analytics › Business › Channel ROI, and it is not linked to this attribution model.
FAQ
What are the main types of attribution models?
Single-touch models (first touch, last touch), rule-based multi-touch models (linear, position-based, time decay, W-shaped) and data-driven models that learn credit from your own conversion paths. They differ in how credit is split, not in which touches they can see.
Which attribution model is best?
None is best in general. Last touch suits short cycles, first touch answers where demand starts, position-based or linear suit long journeys, and data-driven needs volume. Pick by the question, and compare at least two models before acting.
What is the difference between first-touch and last-touch attribution?
First touch gives the whole conversion to the earliest touch; last touch gives it to the final one. In the example, paid social earned $700 under first touch and $0 under last touch from the same ten conversions.
Does attribution show what caused a sale?
No. Attribution shares credit among touches that happened before the conversion; it cannot show what would have happened without them. For cause, use a holdout or incrementality test.
How long should the lookback window be?
Match it to your buying cycle: a few days for impulse purchases, 30 days or more for considered ones. Keep it constant when comparing periods, and report it with the result.
See also: Custom Attribution Model: How to Set Weights and Check Them.
Sources
Was this article helpful?
We use your answers to fix and expand this page.
Couldn’t send. Please try again in a minute.
Thanks for the feedback. We’ll use it to improve this page.You’ve already sent feedback on this page. Thanks.

Product Adoption Consultant
Explores customer onboarding, live conversations, and self-service, turning common usage questions into practical guidance and improvements.