Try it on your own data
Every report in this article is in the free plan. One snippet for web and apps, up to 10 sites.
Start freeAttribution is the rule that decides which touchpoint gets credit for a conversion. A buyer usually has several touches before an order, and every model divides the credit differently, so there is no correct model, only one that suits your decision. Below: the five common models, one order scored under all of them, and how to choose.
What you will learn
- Attribution is a rule for sharing credit, not a measurement of cause
- Score the same conversions under at least two models; a channel whose credit differs by more than two to one is model-sensitive
- Choose by decision: first touch for openers, last touch for closers, linear or position across a long cycle, time decay for short promotions
What is attribution, and what question does it answer?
Attribution is the rule that decides which touchpoint gets credit for a conversion. A buyer rarely arrives and purchases in one visit: they might click a paid social ad, come back through organic search, open an email and finally purchase after a branded paid search click. All four touches happened before the order. Attribution is the method for dividing that one order, and its revenue, among them.
The important word is rule. There is no measurement that reveals the true share of each touch; every attribution model is a choice about how credit should be shared, and different choices give different answers from identical data. That is the claim this guide builds on: there is no correct attribution model, only a model that suits the decision you are making. The worked example below takes one four-touch order and shows credit for the same channel moving from $200 to $0 depending on the rule.
Attribution assigns credit; it does not prove cause. A channel that gets credit may have simply been present when the buyer was already going to purchase. Proving that a channel caused sales needs a controlled test, covered in the limits section. Advanced approaches that weigh touches statistically are covered in multi-touch attribution; this guide stays with the rules you can calculate by hand. The shorter definition is on the attribution page.
The five common attribution models
Five rule-based models cover most practical work. The list gives each rule and the table beneath it adds when each is useful; the sections after show the effect on a real path.
- First touch gives all the credit to the first session in the window. It answers "what starts demand?" and ignores everything that closes it.
- Last touch gives all the credit to the final session before the conversion. It answers "what closes?" and ignores everything that built interest. It is the easiest to calculate and the one most reports default to; see last-click attribution.
- Linear splits credit equally across every touch. It treats the journey as a team effort and cannot tell a decisive touch from an incidental one.
- Time decay gives more credit to touches closer to the conversion, using a half-life: a touch loses half its weight for every half-life of distance from the conversion. It suits short promotions where recent exposure matters most.
- Position-based gives most credit to the first and last touches and a smaller share to the middle ones, for example 40% to each end and 20% shared among the rest. It values both starting and closing. See position-based attribution.
Google Analytics shows how much the choice matters in practice: its attribution documentation lists data-driven attribution, which distributes credit based on data for each key event, and last-click models that attribute 100% of the key event value to the last channel clicked. Different tools default to different rules, which is one reason two reports about the same period rarely agree.
| Model | Rule | Best for | Risk |
|---|---|---|---|
| First touch | All credit to the first session in the window | Finding which channels start journeys | Ignores everything that closes the sale |
| Last touch | All credit to the final session before conversion | Judging closers such as retargeting and brand search | Gives assists zero credit |
| Linear | Equal share to every touch | Long journeys where every stage matters | Cannot tell a decisive touch from an incidental one |
| Time decay | More credit to touches nearer the conversion (half-life) | Short promotions | Undervalues openers on long cycles |
| Position-based | Most credit to first and last touch, the rest shared (for example 40/20/40) | Valuing both starting and closing | The 40/20/40 split is a convention, not a finding |
Rule-based models share credit; they do not prove that a touch caused the sale.
Worked example: one order, four touches, five answers
Sample data: a customer places a $200 order. Before it, they had four sessions, counted back from the day of the order:
| Touch | Channel | Days before the order |
|---|---|---|
| 1 | Paid social | 21 |
| 2 | Organic search | 12 |
| 3 | 4 | |
| 4 | Paid search | 0 (the session of the order) |
Credit for the $200 under each rule:
| Channel | First touch | Last touch | Linear | Position-based (40/20/20/40) | Time decay (7-day half-life) |
|---|---|---|---|---|---|
| Paid social | $200.00 | $0 | $50.00 | $80.00 | $11.89 |
| Organic search | $0 | $0 | $50.00 | $20.00 | $28.99 |
| $0 | $0 | $50.00 | $20.00 | $64.01 | |
| Paid search | $0 | $200.00 | $50.00 | $80.00 | $95.12 |
| Total | $200.00 | $200.00 | $200.00 | $200.00 | $200.00 |
How the figures are built. Linear is 200 ÷ 4 = 50 each. Position-based gives 40% of 200 = 80 to the first and last touches and shares the remaining 20% (40) between the two in the middle, 20 each. Time decay weights each touch by 2 to the power of minus its age divided by the half-life, so the weights are 2^(−21/7) = 0.125, 2^(−12/7) = 0.305, 2^(−4/7) = 0.673 and 2^0 = 1.000; they sum to 2.103, and each touch gets 200 times its weight divided by that sum, giving 11.89, 28.99, 64.01 and 95.12.
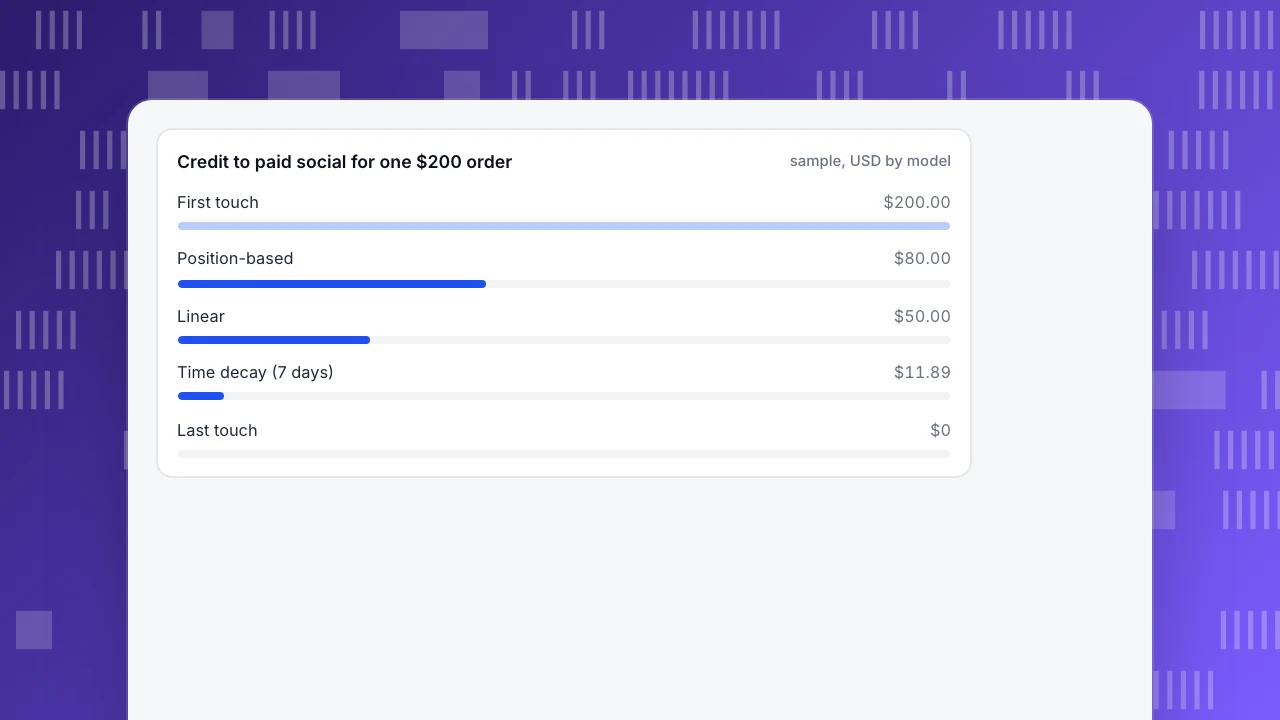
Credit to paid social for one $200 order
sample, USD by modelWhat the example shows
Read down any one channel and the credit swings widely: paid social is worth $200 under first touch, $0 under last touch, and $11.89 under time decay. Email, a touch that most reports never mention under last click, gets $0, $50 or $64.01 depending on the rule. Paid search gets $200 or $95.12 or $50. The order and its revenue did not change; only the rule did.
This is why comparing models side by side is more useful than choosing one. A channel whose credit stays high under every model is carrying real weight. A channel that earns credit under last touch only is a closer; a channel that earns credit under first touch only is an opener. A channel that appears under linear or time decay but never under first or last touch is an assist: it rarely starts or ends a journey but is present in many. In the example, email is the assist, and a team using last click alone would see it as worth nothing and might cut it.
Sensitivity is itself a signal. If a channel's credit differs by more than about two to one between models, the model is making the decision, not the data, and the safer step is a small test (reduce spend or exposure in one region and watch) rather than a budget move based on one rule. For how long journeys actually run in your data, see conversion paths.
How to choose a model
Start from the decision, then pick the rule that answers it.
| If you are deciding… | Look first at | Because |
|---|---|---|
| Where to find new demand (awareness spend) | First touch | It shows which channels open journeys |
| Which channels to keep for closing (retargeting, brand search) | Last touch | It shows who completes journeys |
| How to split budget over a long consideration cycle | Linear or position-based | Every stage gets some credit, so no stage is starved |
| Whether a short promotion worked | Time decay | Recent exposure should count most |
Then apply three checks. First, look at the average number of touches per conversion: if it is close to 1, the journeys are short and every model gives nearly the same answer, so use the simplest. Second, set the lookback window to your real buying cycle; a 7-day window on a product that takes 40 days to decide drops the openers entirely. Third, never act on a single model; compare at least two and look for channels that change rank.
What attribution cannot tell you
- It is not proof of cause. Credit means a touch was present, not that it changed the outcome. A holdout test, where one comparable group is not shown the channel, is the way to measure cause; TapCub does not run such tests, it only measures.
- It only sees tracked touches. Offline conversations, links shared in private messages, a second device or a browser that clears identifiers are missing from the path.
- It depends on the window. Touches outside the lookback window get no credit, and a conversion with no session inside the window stays unattributed.
- Data-driven models are estimates, not facts. Statistical approaches such as Shao and Li's 2011 paper on data-driven multi-touch attribution, which uses logistic regression on observed paths, estimate each channel's weight from patterns. They are only as good as the data fed to them.
- Different tools disagree. Each platform credits the conversions it touched, so the sum across tools can exceed your order count. Use your own order records as the total.
Common mistakes
- Looking for the correct model. There isn't one; choose by decision, as above.
- Switching models to make a channel look better. Pick the model before you look at the result, and keep it for the whole review period.
- Cutting an assist channel because last click gives it nothing. Check linear or time decay first.
- Using a window shorter than the buying cycle. The openers disappear and last touch gets all the credit by default.
- Reading small counts. A channel with five conversions can change rank because of one order; wait for dozens.
- Treating attribution as spend efficiency. Credit divided by spend is only a ratio if both use the same definitions; compare to a measured cost per acquisition before moving budget.
Seeing attribution models side by side in TapCub
Take the four-touch order above. In TapCub you can run it across many orders and see the same five columns without a spreadsheet.
- Define the goal. Open All-platform analytics › Behavior › Behavior analysis, pick attribution, and set the measurement: one event or page (a purchase, a signup), written like a funnel step. It is required.
- Choose the touch and the window. The touch defaults to channel (an empty channel falls back to the referrer channel); you can switch to referrer channel, UTM source, UTM campaign, referrer domain or landing page. The lookback window defaults to 30 days (1 to 90) and includes the session of the conversion itself.
- Select several models at once. First touch, last touch, linear, position (one touch gets everything; two touches split in half; with more, the first and last get 40% each and the middle shares 20%) and time decay (half-life defaults to 7 days, 1 to 90). Each selected model becomes a column of credited conversions, so a channel with credit in linear but not in last touch stands out. TapCub's time-decay weights use the seconds from session start to conversion, so expect small differences from the hand calculation above.
- Read the four numbers. Conversions, attributed conversions, conversions with no touch, and the average number of touches on an attributed conversion. Each row also has paths (conversions that included the touch), touch sessions and a touch rate (paths ÷ touch sessions).
- Know the limits. Up to 50,000 conversions are scored; past that the unattributed count is inflated. This report uses sessions before the conversion, not install postbacks, and it is separate from the spend table in All-platform analytics › Business › Channel ROI.
TapCub measures and compares these models; it does not decide which model is correct, and it does not run experiments to prove cause.
FAQ
What is attribution in marketing?
Attribution is the rule that assigns credit for a conversion, such as a purchase or signup, to the marketing touchpoints that came before it. Because a buyer usually has several touches, the rule you choose decides which channel looks valuable. It describes how credit is shared, not what caused the sale.
What are the main attribution models?
The five common rule-based models are first touch, last touch, linear, time decay and position-based. First and last touch give all the credit to one session; linear shares it equally; time decay favours recent touches; position-based favours the first and last. Data-driven models estimate weights statistically instead.
Which attribution model is best?
None is correct in general; the right one depends on the decision. First touch shows which channels start journeys, last touch shows which close them, and linear or position-based share credit across a long cycle. Compare at least two side by side, and treat a channel whose credit differs by more than two to one as model-sensitive.
What is the difference between attribution and incrementality?
Attribution shares credit among touches that happened before a conversion. Incrementality asks whether the conversion would have happened without the touch, and is measured with a controlled comparison such as a holdout group. Attribution is cheap and always available; incrementality is stronger evidence but needs a test.
What lookback window should I use?
Match it to your real buying cycle. Look at how many days pass between a customer's first and last session before purchasing, and set a window that covers most of them. TapCub's default is 30 days and can be set from 1 to 90.
See also: Attribution Models: Types, Differences and How to Choose.
See also: Revenue attribution: how five models credit the same three orders.
Sources
- Google Analytics Help, Get started with attribution.
- Xuhui Shao and Lexin Li, Data-driven multi-touch attribution models, Proceedings of the 17th ACM SIGKDD International Conference on Knowledge Discovery and Data Mining, 2011.
Was this article helpful?
We use your answers to fix and expand this page.
Couldn’t send. Please try again in a minute.
Thanks for the feedback. We’ll use it to improve this page.You’ve already sent feedback on this page. Thanks.

Product Adoption Consultant
Explores customer onboarding, live conversations, and self-service, turning common usage questions into practical guidance and improvements.