Try it on your own data
Every report in this article is in the free plan. One snippet for web and apps, up to 10 sites.
Start freeQualitative data is descriptive information, such as words, categories and observations, rather than numbers. In product work it is chat messages, reviews, interview notes and what you see in a session replay. Use quantitative data to find where something is wrong and qualitative data to explain why. The method is coding: label each item, count the labels, then check the labels with a second reader.
What you will learn
- Numbers locate the problem and words explain it, so use both in a loop: locate, explain, act, verify
- Code text into a small codebook and count it; coded counts describe the messages you read, not all visitors
- Have a second person code the same sample and compute agreement; kappa 0.72 on 50 messages is substantial, and the disagreements show which definitions to sharpen
What counts as qualitative data, and what does not?
Qualitative data is information recorded as words, categories, images or observations rather than as quantities. A support message, an interview note, an app review and the label "wrong size" are all qualitative. A session count, a price and a response time are quantitative. The NNLM data glossary puts it simply: qualitative data represents information and concepts that numbers do not.
Three edge cases cause most of the confusion:
| Case | Qualitative or quantitative? | Why |
|---|---|---|
| Postcode, plan ID, customer number | Qualitative (a label) | It is written with digits, but adding or averaging two of them means nothing |
| Rating from 1 to 5 | Ordinal: ordered categories | You can rank answers but the gap between 3 and 4 is not a known amount. Some sources file ordinal data under qualitative, some call it in-between; see ordinal data |
| Free-text comment turned into counts ("18 of 50 mention pricing") | Qualitative data, summarised with numbers | The counts come from your coding, not from the comment itself |
A quick test: if the average or sum of the values has a real-world meaning, it is quantitative; if the useful operations are reading, grouping and counting how many fall in each group, it is qualitative. For the full definition see qualitative data and quantitative data; this guide covers examples and how to turn them into something you can act on. The head-to-head comparison is in qualitative vs quantitative data.
What are ten examples of qualitative data in a product or support team?
| # | Example | How it is collected | What you usually code for |
|---|---|---|---|
| 1 | Live chat messages from visitors | Chat transcripts | Topic (pricing, setup, bug), intent (buy, cancel, learn) |
| 2 | Offline messages (email plus a question) | Form shown when nobody is online | Same topics, plus which page the visitor was on |
| 3 | Agents' internal notes on a conversation | Notes written in the inbox | Root cause, what was promised, follow-ups |
| 4 | What you see in a session replay | Watching a recorded session | Where the person hesitated, backtracked or clicked something that did not respond |
| 5 | Interview notes | One-to-one calls | Goals, workarounds, reasons for switching |
| 6 | Open-text survey answers | A survey tool you run yourself | Reasons behind a score; compare with CSAT |
| 7 | App store and review-site reviews | Public listings | Complaints and praise by feature |
| 8 | Cancellation reasons | A free-text field at cancellation | Price, missing feature, switched, no longer needed |
| 9 | Feature requests | Email, community posts, sales calls | The job the person is trying to do, not the proposed solution |
| 10 | Usability test observations | Moderated or unmoderated test sessions | Tasks that failed, where, and the person's own words |
Two features distinguish good sources from poor ones. They are written close to the moment of the problem (a chat message beats a survey sent a month later), and they come from many different people rather than the few who speak up most.
| Example | Collected by | Code it for |
|---|---|---|
| Live chat messages | Chat transcripts | Topic and intent |
| Offline messages | Form shown when nobody is online | Topic and page |
| Agent internal notes | Notes in the inbox | Root cause and follow-up |
| Session replay observations | Watching recorded sessions | Hesitation and dead clicks |
| Interview notes | One-to-one calls | Goals and workarounds |
| Open-text survey answers | Your own survey tool | Reasons behind a score |
| App and site reviews | Public listings | Complaints and praise by feature |
| Cancellation reasons | Free-text field | Price, missing feature, switched |
| Feature requests | Email, community, sales calls | The job to be done |
| Usability test observations | Test sessions | Failed tasks and wording |
The best sources are written close to the moment of the problem and come from many different people.
How do you code qualitative data into categories you can count?
Coding means attaching a short label to each piece of text so you can count and compare. Braun and Clarke (2006) describe thematic analysis in six phases: get familiar with the data, generate initial codes, search for themes, review them, define and name them, and write up. A lightweight version for product work fits in an afternoon:
- Read a first batch without labelling. Read 20 or so messages and note what comes up. You are collecting candidate categories.
- Write a codebook. For each code: a name, a one-line definition, one example message and one "does not belong here" rule. Codes that cannot be defined in a sentence get split or dropped.
- Pick one rule for multiple topics. Either one primary code per message (simple, counts add to 100%) or several codes per message (richer, counts add to more than 100%). Decide before you start.
- Code every message in the sample. Add a code only when the existing ones do not fit, then go back and re-check earlier items.
- Tally and quote. Report the counts, and attach one or two real quotes to each category so the numbers keep their meaning.
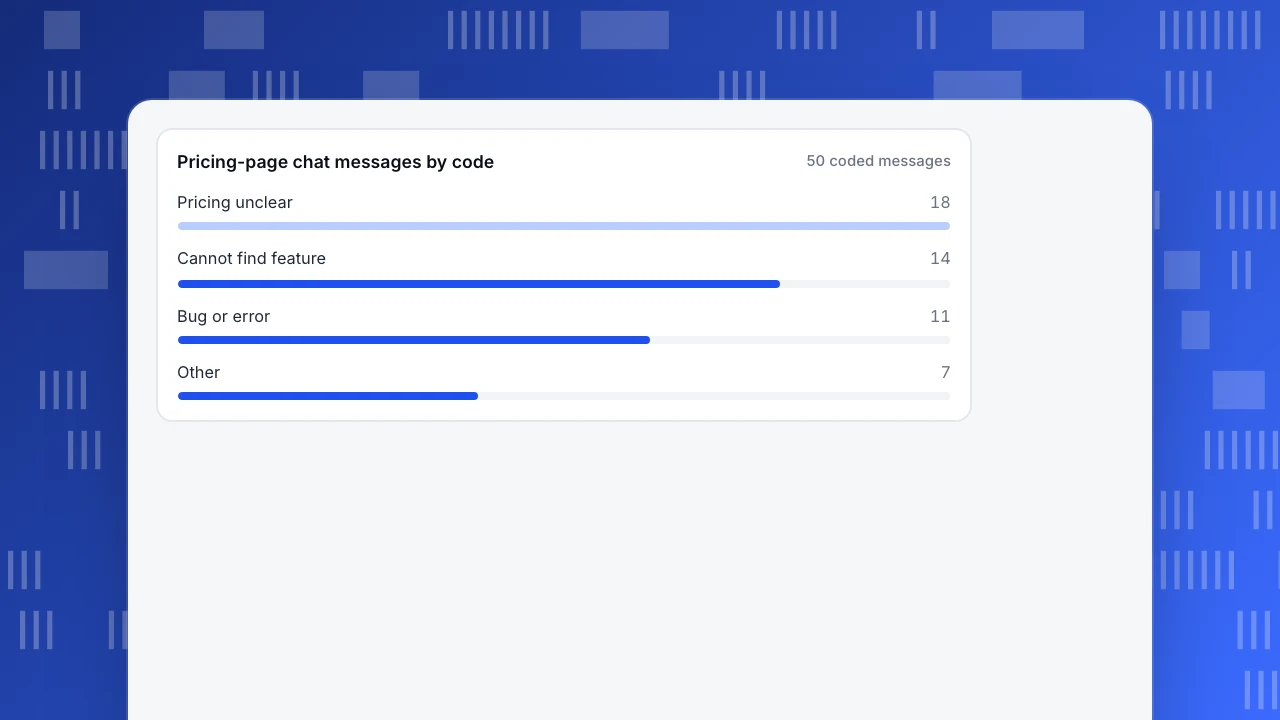
Worked example. Sample data: 50 chat messages from visitors who opened chat while on a pricing page, coded with one primary code each into four categories.
| Code | Definition | Messages | Share of 50 |
|---|---|---|---|
| Pricing unclear | Cannot tell what a plan includes or costs | 18 | 36% |
| Cannot find feature | Looking for something the product has, or may have | 14 | 28% |
| Bug or error | Something failed | 11 | 22% |
| Other | Praise, greetings, off-topic | 7 | 14% |
The counts add to 50 (18 + 14 + 11 + 7), and the shares add to 100%. Two cautions: "Other" is 14%, small enough that the codebook is probably adequate (if Other were the largest group, the codes would be wrong), and the percentages describe these 50 messages, not all visitors, because people who start a chat are not a random sample.
Pricing-page chat messages by code
50 coded messagesHow do you know two people would code it the same way?
A codebook only helps if a second person reaches the same labels. Have someone else code the same 50 messages independently, then compare. Raw agreement overstates reliability because some matches happen by chance, so researchers use Cohen's kappa (Cohen, 1960): (observed agreement − chance agreement) ÷ (1 − chance agreement).
Sample data: two coders on the same 50 messages, in a table with coder 1 in the rows and coder 2 in the columns (categories in the order Pricing, Feature, Bug, Other):
| Pricing | Feature | Bug | Other | Row total | |
|---|---|---|---|---|---|
| Pricing | 15 | 2 | 0 | 1 | 18 |
| Feature | 2 | 11 | 1 | 0 | 14 |
| Bug | 0 | 1 | 9 | 1 | 11 |
| Other | 1 | 0 | 1 | 5 | 7 |
| Column total | 18 | 14 | 11 | 7 | 50 |
- Observed agreement: (15 + 11 + 9 + 5) ÷ 50 = 40 ÷ 50 = 0.80
- Chance agreement: (18² + 14² + 11² + 7²) ÷ 50² = 690 ÷ 2,500 = 0.276
- Kappa: (0.80 − 0.276) ÷ (1 − 0.276) = 0.724
A kappa of 0.72 falls in the "substantial" band of the Landis and Koch (1977) benchmark (0.61 to 0.80). Look at where the 10 disagreements sit: the largest cluster, 4 of the 10, is between Pricing and Feature, which says those two definitions need a sharper boundary. Fix the codebook, then recode the disagreeing messages.
How do qualitative and quantitative data work together?
The strongest pattern is a loop: numbers find the place, words explain it, numbers check the fix.
| Step | Question | Data | Sample result |
|---|---|---|---|
| 1. Locate | Where do people drop? | Quantitative (funnel, page report) | Sample data: of 4,000 pricing-page sessions, 120 (3.0%) go on to start signup |
| 2. Explain | Why do they leave? | Qualitative (chat messages, replays) | 18 of 50 coded messages (36%) say they cannot tell what a plan includes |
| 3. Act | What would address the top reason? | Judgement | Add a plan comparison table above the fold |
| 4. Verify | Did it work? | Quantitative again | Same funnel step, next four weeks |
Quantitative data cannot tell you step 2, because a funnel records where people stopped, never what they were thinking. Qualitative data cannot tell you step 1 or 4 with confidence, because 50 messages do not size a problem. For ways to find friction before you start reading, see user friction and session replay.
Which mistakes make qualitative analysis misleading?
- Treating coded counts as population percentages. "36% of messages" is a statement about the messages you read. People who chat or write reviews are self-selected, as in selection bias.
- Deciding the answer first. If you already believe pricing is the problem, you will code ambiguous messages as pricing. Write the codebook before the tally, and let a second person check.
- Quoting the most vivid comment. One angry paragraph is memorable and may be rare. Report the count beside the quote.
- Coding too finely. Thirty codes from fifty messages gives most codes one or two items. Merge until each code is something you could act on.
- Letting "Other" grow. If it is the biggest group, the codebook does not describe the data.
- Never closing the loop. Qualitative findings should end in a testable change, then a number.
How do you do this in TapCub?
Take the pricing-page example and run it with TapCub as the quantitative half and the conversation content as the qualitative half. TapCub does not code text for you or run surveys; it gives you the messages and the numbers around them.
- Locate the page. Open Live chat › Reports, where the heatmap and hot pages list shows the top 10 pages where visitors started a chat. If the pricing page is on that list, it is a candidate.
- Pull the messages. In Live chat › Inbox, search the conversation list by message text (for example "plan" or "price") and read the conversations. Offline messages, left when nobody is online, are a second source of visitor text.
- Code and annotate. Do the coding in your own spreadsheet. Use Internal note in the conversation to record the code against the conversation, so an agent opening it later sees it.
- Add a behavioural check. In All-platform analytics › Behavior › Session replay, watch sessions from the same page to see whether the hesitation you read about is visible. Replay is off by default and has to be switched on first.
- Verify the fix. After changing the page, compare the same funnel step in All-platform analytics › Behavior › Behavior analysis over the same length of time. Note that conversations are counted as conversations, not analytics sessions, so do not add the two counts together.
FAQ
What is qualitative data in simple words?
Qualitative data describes something in words, labels or observations instead of quantities: a customer's message, an interview note, a product category. You read it, group it into themes and count how many items fall into each. It answers why and how questions that numbers alone cannot.
What are examples of qualitative data?
Chat messages, interview transcripts, open-text survey answers, app reviews, cancellation reasons, feature requests, support notes and observations from watching someone use a product. A rating from 1 to 5 is usually called ordinal rather than purely qualitative.
Is qualitative data always text?
No. Images, screenshots, audio and video recordings and field observations are qualitative as well. Text is simply the type most product teams collect, because it is cheap to gather and easy to search.
Can you turn qualitative data into numbers?
Yes, by coding. Assign each item a category and count the items per category. The numbers describe your coding of the sample, not the full audience, so report the sample size and how people came to be included.
How much qualitative data is enough?
Keep reading until new messages stop producing new codes, then check reliability with a second coder on a subset. There is no universal number; what matters is that the categories stop changing and that two coders agree.
Sources
- NNLM (Network of the National Library of Medicine). Data glossary: qualitative data.
- Braun, V., Clarke, V. (2006). Using thematic analysis in psychology. Qualitative Research in Psychology, 3(2), 77–101.
- Cohen, J. (1960). A coefficient of agreement for nominal scales. Educational and Psychological Measurement, 20(1), 37–46.
- Landis, J. R., Koch, G. G. (1977). The measurement of observer agreement for categorical data. Biometrics, 33(1), 159–174.
Was this article helpful?
We use your answers to fix and expand this page.
Couldn’t send. Please try again in a minute.
Thanks for the feedback. We’ll use it to improve this page.You’ve already sent feedback on this page. Thanks.

Technical Engineer
Focuses on tracking code, SDKs, and API integrations, with practical guidance on implementation checks and troubleshooting.