Try it on your own data
Every report in this article is in the free plan. One snippet for web and apps, up to 10 sites.
Start freeTo improve CSAT, start with the low scores, not the average. Read every 1- and 2-star conversation from the last 30 days and tag one cause each. In most queues the low scores cluster around waiting too long and problems left unresolved, not agent attitude, so fixing staffing, expectations and resolution moves the score more than tone coaching. Below: the formula, a cause audit, a worked example and how to verify a change.
What you will learn
- Sort 1- and 2-star conversations by cause before changing anything; the average hides where the problem is
- Waiting and unresolved problems usually outweigh tone: fix staffing, expectations and agent authority first
- Verify within the group a change targets; with 300 ratings, CSAT moves under about 5 points can be noise
What CSAT measures and how to calculate it
CSAT (customer satisfaction score) is the share of rated interactions that customers scored as satisfied. On the common 1–5 scale, "satisfied" means a 4 or a 5:
CSAT = ratings of 4 and 5 ÷ all ratings × 100
If 300 customers rated their chat and 226 gave a 4 or 5, CSAT is 226 ÷ 300 = 75.3%. The CSAT calculator does this from your own counts and shows the distribution alongside the score.
Some teams report the average rating instead (for example 4.1 out of 5). Both are fine for tracking a trend, but they hide different things. A 1–5 rating is an ordinal variable: the steps are ordered, but the distance between a 1 and a 2 is not guaranteed to equal the distance between a 4 and a 5. Stevens' classic paper on measurement scales makes the same point: means assume equal intervals that ordinal data does not have.
A concrete case shows why it matters. Team A gets 100 ratings: 90 fours, 5 threes and 5 fives: average (360 + 15 + 25) ÷ 100 = 4.0, CSAT 95%. Team B gets 20 ones, 20 fours and 60 fives: average (20 + 80 + 300) ÷ 100 = 4.0, CSAT 80%. Same average, yet one team has a fifth of its customers very unhappy. Whatever headline number you use, always look at the low scores underneath it, because that is where the improvement is.
Start with the low scores, not the average
The fastest way to improve CSAT is not a new initiative; it is reading the conversations that scored 1 or 2 and sorting them by cause. In most support queues, low scores cluster around a few process problems — the customer waited too long, or the problem was not solved — rather than around agent attitude. A 30-day audit tells you which is true for you:
- Export every 1 and 2 from the last 30 days, with the transcript, wait time and whether it was resolved.
- Tag one primary cause per conversation, using a short fixed list (see the table below). If two apply, pick the one that would have prevented the low score if fixed.
- Count by cause and by the conditions around it: time of day, wait band, topic, agent.
- Separate what support controls from what it doesn't. A score of 1 for a broken product is real feedback, but coaching the agent won't fix it.
The table below lists the causes worth tagging, the signal that identifies each in a transcript, and the usual fix. Keep the list short; a dozen causes turns the audit into an argument about labels.
| Cause | Signal in the transcript | Usual fix |
|---|---|---|
| Waited too long | Long gap before the first human reply; 'hello?' messages | Staff peak hours; state the expected wait; offline form with an honest reply time |
| Not resolved | No answer, or the customer came back about the same issue | Close knowledge gaps; let agents fix common issues |
| Repeated or transferred | Customer re-explains; more than one agent | Route by topic; pass a summary on transfer |
| Policy said no | Request refused with no alternative | Offer what you can do instead |
| Product fault | Bug, defect or missing feature | Send to the product team; tag outside support CSAT |
| Agent tone | Stock phrases, blame, no acknowledgement | Coach concrete wording |
Tag one primary cause per low-scoring conversation: the one that would have prevented the low score if fixed.
Worked example: 300 rated chats by wait time
Sample data: an online store collected 300 ratings on resolved chats in one month and grouped them by how long the customer waited for the first human reply.
| Wait for first reply | Rated | 4–5 | 3 | 1–2 | CSAT |
|---|---|---|---|---|---|
| Under 1 min | 120 | 108 | 6 | 6 | 108 ÷ 120 = 90.0% |
| 1–5 min | 90 | 72 | 10 | 8 | 72 ÷ 90 = 80.0% |
| 5–15 min | 54 | 32 | 8 | 14 | 32 ÷ 54 = 59.3% |
| Over 15 min | 36 | 14 | 2 | 20 | 14 ÷ 36 = 38.9% |
| All | 300 | 226 | 26 | 48 | 226 ÷ 300 = 75.3% |
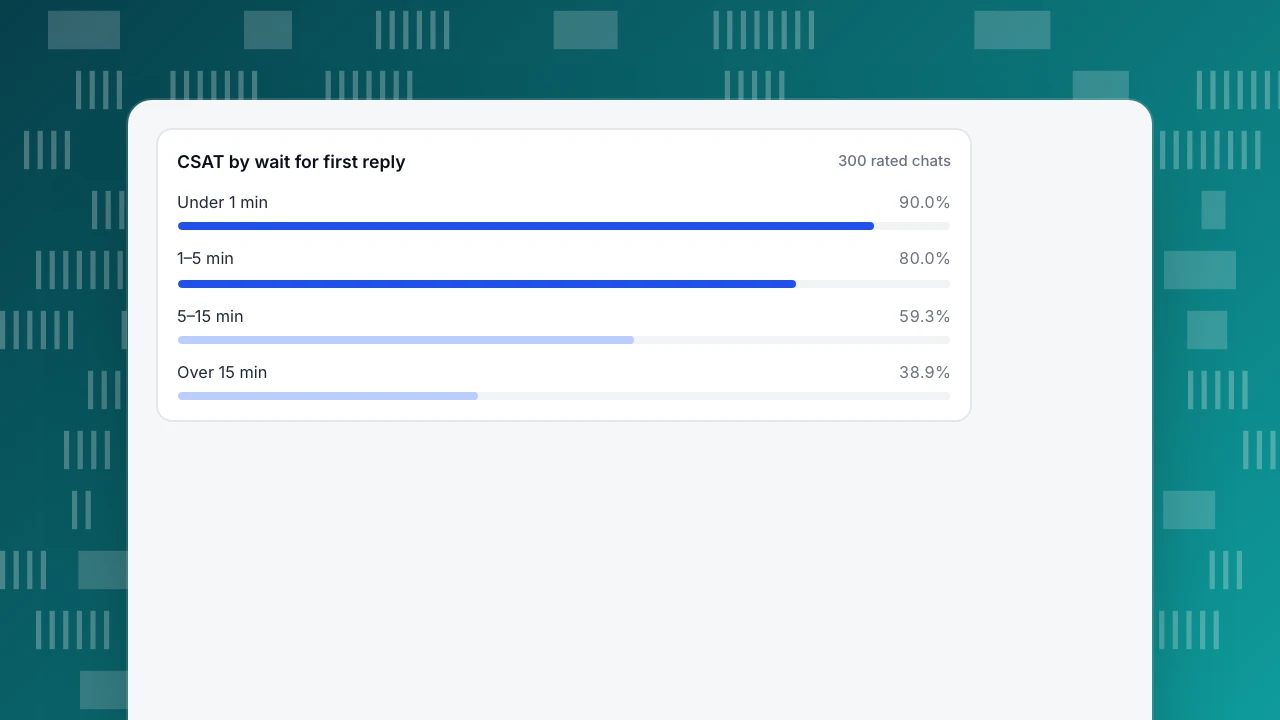
Two things stand out. CSAT falls steadily with waiting, from 90.0% to 38.9%. And the 90 chats that waited more than five minutes produced 14 + 20 = 34 of the 48 low scores: 34 ÷ 48 = 70.8%, from less than a third of the rated chats (90 ÷ 300 = 30%).
Then the cause audit on the 48 low scores:
- Waited too long — 19
- Not resolved (no answer, or the fix didn't work) — 14
- Had to repeat themselves or was transferred — 6
- Policy said no — 4
- Product fault, not support — 3
- Agent tone — 2
Waiting and non-resolution together account for 19 + 14 = 33 of 48 low scores, or 68.8%. Agent tone accounts for 2 of 48, or 4.2%. A team that responded to a falling CSAT with a politeness workshop would be working on the smallest slice.
What would fixing the wait be worth? If the 90 chats that waited over five minutes scored like the 1–5 minute band (80.0%), they would produce 0.80 × 90 = 72 satisfied ratings instead of 32 + 14 = 46. CSAT would move from 226 ÷ 300 = 75.3% to (226 − 46 + 72) ÷ 300 = 252 ÷ 300 = 84.0%. Treat that as an upper estimate: long waits happen at peak hours, when questions may also be harder, so faster replies alone won't capture all of it.
CSAT by wait for first reply
300 rated chatsFix waiting first: response time and expectations
When waiting drives the low scores, there are two levers: wait less, and make the wait you can't avoid feel shorter.
Wait less. Measure first response time per hour of the week, not as a monthly average; the average hides the Monday-morning queue. Staff to the peaks, not the mean. The first response time calculator works out the figure from your own timestamps, and the chat staffing calculator estimates agents needed per hour.
Make the wait feel shorter. David Maister's 1985 essay on the psychology of waiting lines sets out propositions that still describe support queues well, including that uncertain waits feel longer than known, finite ones, and unexplained waits feel longer than explained ones. In practice:
- Tell the customer what to expect: "We usually reply within 10 minutes" beats silence.
- If you need time, say what you are checking and for how long.
- Don't show "online" when nobody can answer. Outside staffed hours, an offline form with an honest reply time ("by 10 am tomorrow") is better than a chat that looks live and isn't.
A rule of thumb from the example: if more than a quarter of your low scores come from waits over five minutes, fix staffing and expectations before anything else.
Fix "not resolved": resolution and handoffs
The second big cluster is conversations that ended without a fix. Track resolution rate, but read it critically: a chat marked resolved that brings the customer back two days later was not resolved.
Changes that address non-resolution:
- Close the knowledge gaps. Read the "not resolved" transcripts for the question behind them. If agents didn't know the answer, write it down where everyone can find it.
- Give agents authority for common fixes. If a refund under a set amount needs a manager, every such chat ends with "I'll pass this on". Set a threshold agents can act on themselves.
- Cut transfers. Each handoff makes the customer repeat themselves. Route by topic at the start, and when a transfer is unavoidable, pass a written summary so the customer doesn't start over.
- Follow up when you promise to. "I'll get back to you" without a time is a future low score.
This matches the argument Dixon, Freeman and Toman made in Harvard Business Review in 2010: customers reward companies that make problems easy to solve more than companies that try to exceed expectations. Effort — repeating, waiting, being transferred — is what the low scores in the example are mostly about.
Fix the conversation itself: tone and training
Tone does matter; it just matters less often than teams assume. Once waits and resolution are under control, look at the remaining low scores for tone problems: stock phrases, missing acknowledgement, blaming policy. The fix is concrete wording, not "be nicer": an acknowledgement that names the customer's actual problem, followed straight away by an action. Examples are in empathy statements, and a structure for coaching is in customer service training.
To spot frustration before it becomes a 1-star rating, read the emotional tone of messages during the conversation; customer sentiment covers how that is measured.
Prioritise: which change to make first
Rank changes by how many low scores they address and how much effort they take. Using the sample audit:
| Change | Low scores it addresses (of 48) | Effort | How you'll know it worked |
|---|---|---|---|
| Staff peak hours; state the expected wait | 19 (waited too long) | Medium | CSAT in the over-5-minute bands rises |
| Close knowledge gaps; let agents fix common issues | 14 (not resolved) | Medium | Fewer repeat contacts on the same topic |
| Route by topic; pass a summary on transfer | 6 (repeated or transferred) | Low | Transfers per 100 chats fall |
| Offer an alternative whenever the answer is no | 4 (policy) | Low | Fewer 1s on policy chats |
| Send product faults to the product team | 3 (product) | Low | Tracked outside support CSAT |
| Coach tone with concrete wording | 2 (tone) | Low | Review sample passes the checklist |
The top two rows cover 33 of 48 low scores. Do them first, even though the bottom rows are easier.
How to verify that a change worked
CSAT moves for many reasons, so verify each change deliberately:
- Compare like with like. Measure CSAT within the group the change targets (for example the over-5-minute wait bands) before and after, not just the overall score.
- Mind the sample size. With 300 ratings and CSAT around 75%, the 95% margin of error is about ±4.9 points (1.96 × √(0.753 × 0.247 ÷ 300) ≈ 0.049). A move from 75% to 78% in one month may be noise; a move from 75.3% to 84.0% is not.
- Watch the response rate. If the share of customers who rate drops sharply, the remaining raters may not represent everyone.
- Hold the mix steady. A month with a shipping delay will score lower whatever you changed. Note big events and compare topic by topic.
Common mistakes when trying to improve CSAT
- Watching only the average. As the Team A / Team B case shows, the same average can hide very different shares of unhappy customers.
- Asking for a 5. "Please rate me 5" inflates the score and destroys its value as a signal.
- Blaming agents for product problems. Tag product faults separately so agents aren't coached for something they can't fix.
- Surveying only resolved chats and ignoring customers who gave up waiting. They never rate, and they are often the unhappiest.
- Comparing channels directly. Email and chat customers have different expectations; compare each channel with itself over time.
How to improve CSAT in TapCub
The 300-chat example above runs like this in TapCub live chat.
- Read the score and the drivers on one page. Live chat › Reports shows satisfaction (a 1–5 score the visitor can give within 24 hours after the chat is resolved, one per conversation, averaged to one decimal), average first response (agent replies only, with the median alongside; AI replies don't count) and resolution rate (resolved ÷ conversations), each compared with the previous period. TapCub reports satisfaction as an average; if your team reports CSAT as the share of 4s and 5s, count those from your rated conversations and use the CSAT calculator.
- Find the low scores and read them. In Live chat › Inbox, the Resolved queue shows each conversation's satisfaction score, so you can open the 1s and 2s and tag the cause. Per-agent workload and satisfaction in the report show whether low scores sit with one person or follow the queue.
- Line up the queue against your hours. The report's heatmap counts chat starts by weekday and hour; set it against your staffed hours in Live chat › Chat settings › Office hours. If the over-5-minute waits fall in hours nobody covers, outside those hours visitors get the offline greeting and a form for email and question, managed in Live chat › Chat settings › Offline messages (statuses New, Replied, Closed). Offline messages are counted on their own, not as resolved.
- Shorten the replies that cause waits. Save the answers to your most common questions in Live chat › Canned replies; agents insert them with
/and edit before sending. If you use AI replies, the "only when all agents are offline" mode in Live chat › Chat settings › AI assistant keeps people on the conversations while someone is online. - Re-check the same group a month later. Compare satisfaction and first response for the same hours and topics, not the overall average, and keep the margin of error in mind before calling the change a win.
FAQ
What is a good CSAT score?
There is no universal threshold; it depends on your industry, channel and how you ask. Track your own baseline and, more importantly, the share of 1s and 2s beneath it. A team at 75% with most low scores concentrated in long waits has a clearer path to improvement than a team at 85% with low scores spread across every cause.
What is the fastest way to improve CSAT?
Read the last 30 days of 1- and 2-star conversations and tag each with one cause. If most come from long waits or unresolved problems, fix those first: staff the peak hours, state the expected wait, and let agents resolve common issues without escalating. Those changes usually move CSAT more than tone coaching does.
How does response time affect CSAT?
In most queues, satisfaction falls as waiting grows. In the sample in this article, CSAT dropped from 90.0% for replies under one minute to 38.9% for waits over 15 minutes. Telling customers how long the wait will be also helps, because uncertain, unexplained waits feel longer than known ones.
Should I use average rating or percentage of satisfied customers?
Either works for tracking a trend, but the percentage of 4s and 5s is easier to interpret and less distorted by a few extreme ratings. Whichever you use, look at the distribution too: two teams can share an average of 4.0 while one has a fifth of its customers rating 1.
How many CSAT responses do I need to see a real change?
More than most teams expect. With 300 ratings and a CSAT near 75%, the 95% margin of error is about ±4.9 points, so a three-point change in one month may be noise. Compare the specific group a change targets, over enough weeks to collect a few hundred ratings.
See also: Feedback Questions: 20 to Ask, by Purpose, and How to Word Them.
See also: Customer Satisfaction Tools: What They Measure and When to Ask.
See also: CSAT meaning: what it is, how to calculate it and sample size.
See also: How to Collect User Feedback: Ask After the Task, Then Check What They Did.
See also: Feedback Analysis: Tag Comments Into Themes and Rank Them.
Sources
- David H. Maister. The Psychology of Waiting Lines (1985) — propositions including "Uncertain waits are longer than known, finite waits" and "Unexplained waits are longer than explained waits". Verified 2026-11-15.
- Matthew Dixon, Karen Freeman & Nicholas Toman. Stop Trying to Delight Your Customers. Harvard Business Review, July–August 2010 — reducing customer effort versus exceeding expectations. Verified 2026-11-15.
- S. S. Stevens. On the Theory of Scales of Measurement. Science 103(2684), 1946 — nominal, ordinal, interval and ratio scales and the statistics each permits. Verified 2026-11-15.
Was this article helpful?
We use your answers to fix and expand this page.
Couldn’t send. Please try again in a minute.
Thanks for the feedback. We’ll use it to improve this page.You’ve already sent feedback on this page. Thanks.

Customer Experience Consultant
Writes about live chat, visitor conversations, and self-service, sharing practical ways to make customer communication clearer and more effective.