Try it on your own data
Every report in this article is in the free plan. One snippet for web and apps, up to 10 sites.
Start freeFeedback analysis turns free-text comments into a ranked list of problems: gather them, label each, group the labels into themes, count and act. In the 20-comment sample below, onboarding and pricing each got 4 comments, but onboarding ranks first because 2 of its comments were blocked tasks. Counts this small point to themes, not to proportions.
What you will learn
- Code to the specific problem first, then group into 5 to 8 themes; theme counts must sum to the number of comments
- Rank by blocked task first, then count: Onboarding (4 comments, 2 blocked) outranks Pricing (4 comments, 0 blocked)
- With 20 comments, 4 mentions is 20% with a 95% range of 8.1% to 41.6%, so treat close counts as ties
The five steps of feedback analysis
Feedback analysis turns a pile of free-text comments into a ranked list of problems, each with a count and a proposed action. It works the same for survey answers, support chats, reviews and email. The loop has five steps, and each produces something you can check:
| Step | What you do | What you have afterwards |
|---|---|---|
| 1. Gather | Put every comment in one sheet: one row per comment, with date, source and customer type | A single list, no duplicates |
| 2. Read | Read all of it once before labelling anything | A rough sense of the repeated complaints |
| 3. Code | Give each comment a short label for what it is about | A code on every row |
| 4. Group | Merge similar codes into themes and name them | 5 to 8 themes |
| 5. Count and decide | Count comments per theme, mark which blocked a task, pick actions | A ranked list with owners |
Nielsen Norman Group describes the same logic for qualitative research: a code is "a word or phrase that acts as a label for a segment of text", and a theme is a description of a belief, practice or need discovered from the data, which emerges when related findings recur. Its affinity-diagram guidance adds a practical rule: start grouping notes by content before deciding on a theme label, so the data names the theme, not your assumptions.
This guide uses a 20-comment sample to show every step with numbers. How to ask questions that produce useful comments is covered in feedback questions; what the word means in general is in the user feedback glossary page.
Worked example: 20 comments tagged by theme
Sample data: 20 comments collected in one month from a software product, via a survey box, support chat and email. Each is given one primary theme. A comment that "blocked" a task is one where the person says they could not finish something.
| # | Comment | Theme | Blocked a task? |
|---|---|---|---|
| 1 | Setup took me two hours before I saw any data | Onboarding | No |
| 2 | I could not find where to paste the install code | Onboarding | Yes |
| 3 | Price jump from the free to the paid plan was not clear | Pricing | No |
| 4 | Dashboard loads slowly on Monday mornings | Speed | No |
| 5 | Need a Slack integration for alerts | Integration | No |
| 6 | Support replied after a day, I had moved on | Support | No |
| 7 | Exporting a report to CSV is hard to find | Reporting | No |
| 8 | The pricing page does not say what counts as a seat | Pricing | No |
| 9 | Onboarding checklist was helpful, but step 3 was confusing | Onboarding | No |
| 10 | Charts take 10+ seconds to open for a 90 day range | Speed | No |
| 11 | Would pay more for a CRM integration | Integration | No |
| 12 | Chat answered in two minutes, great | Support | No |
| 13 | I cannot schedule the weekly report to my manager | Reporting | Yes |
| 14 | Annual discount is hidden behind the toggle | Pricing | No |
| 15 | Invite flow for teammates failed twice | Onboarding | Yes |
| 16 | Mobile app is slow on older phones | Speed | No |
| 17 | No webhook for new signups | Integration | No |
| 18 | Nobody told me which plan includes the API | Pricing | No |
| 19 | Agent did not know my previous ticket | Support | No |
| 20 | The dashboard looks good but I need a funnel view | Reporting | No |
Counting the Theme column gives:
| Theme | Comments | Share of 20 | Blocked | Positive |
|---|---|---|---|---|
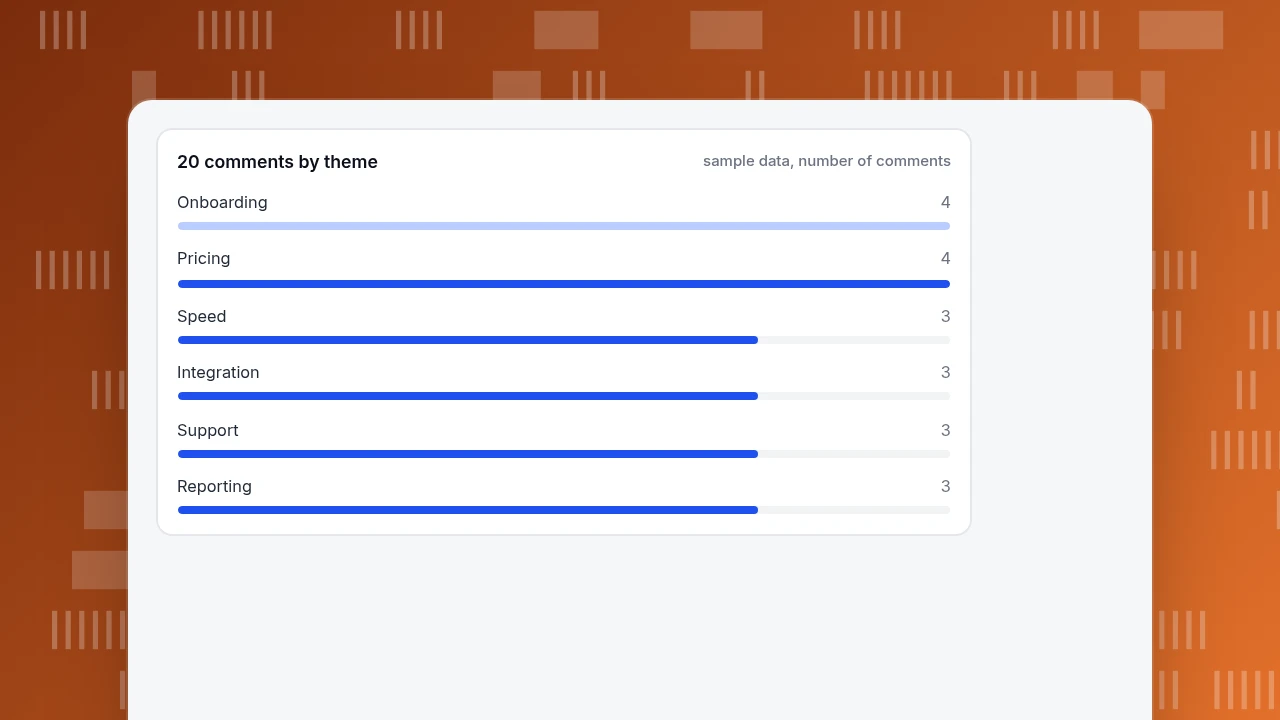
| Onboarding | 4 | 20% | 2 | 0 |
| Pricing | 4 | 20% | 0 | 0 |
| Speed | 3 | 15% | 0 | 0 |
| Integration | 3 | 15% | 0 | 0 |
| Support | 3 | 15% | 0 | 1 |
| Reporting | 3 | 15% | 1 | 0 |
| Total | 20 | 100% | 3 | 1 |
The counts add up (4 + 4 + 3 + 3 + 3 + 3 = 20), which is the first check on any coding sheet: every comment has exactly one primary theme, so the theme counts must sum to the number of comments. If you allow secondary themes, report them in a separate column so the total still reconciles.
20 comments by theme
sample data, number of commentsHow to build the code frame
Do not start with a list of themes. Read and label from the comments, then merge. Five rules keep the frame usable:
- Name the problem, not the department. "Pricing page does not say what counts as a seat" tells an owner what to change; "Pricing" alone does not. Code to the specific problem first (comments 3, 8, 14 and 18 are four different pricing problems), then group.
- One primary theme per comment, secondary allowed. In the sample, comment 9 praises the checklist and complains about step 3; the primary theme is Onboarding, and the praise is noted in a separate column.
- Keep themes between five and eight. Fewer hides differences; more than ten means the frame is a list of comments, not themes.
- Cap "Other" at about 10% of comments. If "Other" is larger, you have an unnamed theme.
- Write a one-line definition for every theme. "Speed: any comment about waiting for a page, chart or app to load." Definitions are what two readers use to agree.
When a comment mixes two complaints, split it into two rows with the same source and date rather than forcing one theme, and say that you did.
Count, then rank: what to act on first
A count alone is not a priority. Rank using three signals, in this order:
- Blocked a task. A comment that says the person could not finish something is more urgent than one that says something is annoying. In the sample, 3 comments are blocked: two in Onboarding (comments 2 and 15), one in Reporting (comment 13).
- Number of comments. Within the same blocking level, more comments rank higher.
- Who said it. If the comments come from customers you most want to keep, count that separately. The sample does not record customer type, so it is left out here, but add it as a column in your own sheet.
Applying the rule to the sample:
| Rank | Theme | Why |
|---|---|---|
| 1 | Onboarding | 4 comments, 2 blocked: people cannot find the install code or send invites |
| 2 | Reporting | 3 comments, 1 blocked: scheduling a report is impossible, and export and funnel views are missing |
| 3 | Pricing | 4 comments, 0 blocked: the page leaves seats, plan limits and the annual discount unclear |
| 4 | Speed, Integration | 3 each, none blocked |
| 5 | Support | 3 comments, one of them positive: two complaints are about delay and lost context |
Pricing has as many comments as Onboarding, but nothing blocked, so it ranks below Reporting even though Reporting has fewer comments. That is the effect of the first signal.
| Rank | Theme | Comments | Blocked | Why |
|---|---|---|---|---|
| 1 | Onboarding | 4 | 2 | Cannot find the install code or send invites |
| 2 | Reporting | 3 | 1 | Scheduling impossible; export and funnel view missing |
| 3 | Pricing | 4 | 0 | Seats, plan limits and annual discount unclear |
| 4 | Speed and Integration | 3 each | 0 | Slow loads; no Slack, CRM or webhook |
| 5 | Support | 3 | 0 | Delay and lost context (one positive comment) |
Sample data: 20 comments, one primary theme each. Ranked by blocked task first, then number of comments.
How much can 20 comments tell you?
Less than the percentages suggest. If 4 of 20 comments are about onboarding, the share is 20%, but the 95% Wilson score interval for 4 out of 20 runs from 8.1% to 41.6%. For 3 out of 20 it runs from 5.2% to 36.0%. Those intervals overlap almost entirely, which means that in a 20-comment set you cannot say onboarding is a bigger problem than speed on counts alone. Edwin Wilson published the interval in 1927 as a better estimate for small samples than the simple normal approximation.
Decision rules that follow:
- Treat a ranking between themes with counts within 1 of each other as a tie. Use blocking, then judgement.
- Use the counts to find themes worth looking at, not to forecast how many customers have the problem.
- To compare themes by share, collect more comments; the interval narrows as the count rises.
- A single comment that says "I cancelled because of this" outranks several mild ones. Keep it visible even when the count is 1.
Check your coding with a second reader
Two people reading the same comments will not always agree, and a theme that depends on who read it is not reliable. A quick check:
- Give a second person the theme definitions and 10 comments, without your labels.
- Compare their primary themes with yours.
- Percent agreement = agreed comments ÷ comments checked. Sample result: they agree on 9 of 10, so 90%.
- For each disagreement, rewrite the definition that caused it. In the sample, the disagreement was comment 20, which one reader tagged Reporting and the other Integration; adding "requests for a view or chart not in the product" to the Reporting definition fixed it.
- If agreement is below about 80%, the definitions are the problem; revise them before counting further.
Turn each theme into a decision
A theme is finished when it has an owner, an action and a metric to check afterwards. Using the top two themes from the sample:
| Theme | Evidence | Action | How you will know it worked |
|---|---|---|---|
| Onboarding | Comments 1, 2, 9, 15 | Show the install code on step 1; add a retry message to the invite flow | Share of new accounts that finish setup within the first day |
| Reporting | Comments 7, 13, 20 | Put export next to the report title; add scheduled delivery | Mentions of export or scheduling in next month's comments |
Write the action as a change to the product or copy, not as a goal like "improve onboarding". Then re-run the same coding sheet next month; if comments about the theme fall and the behaviour metric rises, the fix worked.
In TapCub: where feedback comes from, and what to pair it with
Take the 20-comment sample and the two top themes. TapCub gives you comments from conversations, and the behaviour that sits next to them.
- Collect. Chat conversations and offline messages in Live chat › Inbox are your comment source. Offline messages are visitors who left an email and a question when nobody was available.
- Code. TapCub has no theme or tag field for conversations. Write your theme in an Internal note on the conversation (visible only to agents, up to 4,000 characters), or copy the comment into your coding sheet. TapCub does not run surveys such as NPS or CES; collect those elsewhere and code them in the same sheet.
- Add a number. In Live chat › Reports, satisfaction is a score from 1 to 5 given within 24 hours after a conversation is resolved, averaged to one decimal. Hot pages list the top 10 pages where chats started, so a theme like "can't find the install code" can be matched to the page it was asked on.
- Check the behaviour. Open the visitor profile from the conversation sidebar to see the browsing trail from the last 2 days. After you ship the onboarding fix, check the step in a funnel in All-platform analytics › Behavior › Behavior analysis to see whether more people get through.
TapCub measures what visitors did and says; it does not group comments into themes for you.
FAQ
What is feedback analysis?
Feedback analysis is turning free-text comments into a ranked list of problems: gather the comments, read them, label each one, group the labels into themes, count the themes and choose actions. The 20-comment example above produced six themes, with Onboarding first because two of its four comments were blocked tasks.
How do you analyze customer feedback?
Put each comment in one row, label it with the specific problem, merge labels into five to eight themes, and count. Rank by whether the comment blocked a task, then by number of comments. Check your labels with a second reader before trusting the counts.
How many comments do you need?
There is no fixed number, but a small set tells you less than the percentages suggest. With 4 of 20 comments the 95% Wilson interval is 8.1% to 41.6%. Use a small set to find themes, and collect more before comparing themes by share.
What is the difference between a code and a theme?
A code is a label on one piece of text, such as "install code not found". A theme groups related codes into a broader finding, such as "onboarding". Code first, then group, so the comments decide the theme names.
Should I use AI to analyze feedback?
It can draft codes quickly, but read a sample of its labels against the comments and run the same second-reader check on them. Whatever does the labelling, the counts are only as good as the definitions behind them.
Sources
- Nielsen Norman Group. Thematic analysis (17 August 2022): definitions of code and theme and the six steps. Checked 2026-11-20.
- Nielsen Norman Group. Affinity diagramming: grouping notes by content before choosing a theme label. Checked 2026-11-20.
- Edwin B. Wilson. Probable inference, the law of succession, and statistical inference. Journal of the American Statistical Association 22(158), 1927: the Wilson score interval. DOI link may refuse automated checks.
- Virginia Braun and Victoria Clarke. Using thematic analysis in psychology. Qualitative Research in Psychology 3(2), 2006: the standard reference for coding and themes.
Was this article helpful?
We use your answers to fix and expand this page.
Couldn’t send. Please try again in a minute.
Thanks for the feedback. We’ll use it to improve this page.You’ve already sent feedback on this page. Thanks.

Product Experience Specialist
Writes about product experience, practical workflows, and growth, turning complex processes into clear steps for everyday decisions.