Try it on your own data
Every report in this article is in the free plan. One snippet for web and apps, up to 10 sites.
Start freeFeature request management means recording the problem behind each request, scoring requests on the same scale, and answering every one. The usual scale is RICE: Reach × Impact × Confidence ÷ Effort. Below: six fields to log, five sample requests scored and re-scored under changed estimates, why mention counts mislead, and a three-answer reply table.
What you will learn
- Store the problem the customer has, not only the feature they asked for, and count distinct people instead of mentions
- Score with fixed RICE scales, then double or halve the weakest estimate: if the top three do not change, decide
- Measure Reach from product usage; mention counts reward the loudest channel and can invert the ranking
What is a feature request, and what is it not?
A feature request is a customer's or colleague's proposed solution to a problem they have. The proposal is the part people write down ("add dark mode"). The problem is the part you need ("I use this at night and the white screen hurts"). Those two are not the same, and the gap between them is where most prioritisation mistakes start.
Nielsen Norman Group describes the same trap as solutioneering: teams "are often too quick to propose solutions, without understanding the problem," and its advice is to "ask questions first, before jumping to a solution" (NN/g). For feature requests that means one rule: store the problem, keep the proposed solution as a note.
A request is also not a commitment, a bug, or a vote. A bug is behaviour that contradicts what you shipped. A vote is one person's preference counted once. A request log is a list of problems with evidence attached, and the scoring below turns that list into an order.
What should you record when a request comes in?
Write every request as one row with the same six fields, whatever channel it came from (support chat, a sales call, an email, a community post):
| Field | What to write | Why it matters later |
|---|---|---|
| Problem | One sentence in the requester's words: what they were trying to do and what stopped them | Lets you judge other solutions, not only the one proposed |
| Proposed fix | The feature they asked for, as a note | Keeps the idea without letting it define the problem |
| Who | An account or user ID, not just a name | Lets you count distinct people later |
| Workaround | What they do today | A painless workaround lowers impact; an expensive one raises it |
| Frequency | How often it happens (daily, monthly, once) | Feeds the impact estimate |
| Link | URL of the conversation, ticket or call note | Lets anyone check the evidence in a minute |
Two habits keep the log honest. First, merge duplicates under the problem, not the wording: "export to Excel", "download my table" and "CSV please" are one row with three requesters. Second, count distinct people, not mentions. One customer who asks five times is one data point with five timestamps.
How does RICE scoring work?
RICE turns a request into a number so that five competing requests can be compared on the same basis. It was published by Intercom, and the score is Reach × Impact × Confidence ÷ Effort (Intercom). Intercom's definitions:
- Reach: how many people the change affects in a set period, such as customers per quarter.
- Impact: the effect on each person, on a fixed scale: 3 massive, 2 high, 1 medium, 0.5 low, 0.25 minimal.
- Confidence: how sure you are of the other estimates: 100% high, 80% medium, 50% low, anything lower is a moonshot.
- Effort: total work from product, design and engineering, in person-months.
The score reads as "total impact per person-month of work." Two cautions. First, every team must use the same scales; another vendor's RICE template, for example, asks for Impact and Effort on a 1–5 scale instead (Atlassian), so scores from the two methods cannot be compared. Second, RICE ranks requests, it does not decide for you. Use it to find the disagreement, then discuss that.
| RICE input | Intercom scale | Where the number comes from |
|---|---|---|
| Reach | People per period, e.g. users per quarter | Distinct users who touched the area, from product data |
| Impact | 3 massive, 2 high, 1 medium, 0.5 low, 0.25 minimal | Funnel drop-off or time lost at the step the request is about |
| Confidence | 100% high, 80% medium, 50% low | How many independent pieces of evidence you have |
| Effort | Person-months across product, design, engineering | The team's own estimate, same unit for every request |
Intercom's scales (checked 2026-11-20). Another vendor's template uses a 1-5 scale for Impact and Effort, so scores from different methods cannot be compared.
Worked example: scoring five requests
Sample data: a B2B web app with about 3,000 active users per quarter has collected five requests. The effort numbers are the engineering team's estimates in person-months.
| Request | Reach (users per quarter) | Impact | Confidence | Effort | Score |
|---|---|---|---|---|---|
| CSV export | 800 | 2 | 100% | 1 | 1,600 |
| Saved filters | 1,200 | 1 | 80% | 1.5 | 640 |
| Dark mode | 3,000 | 0.5 | 80% | 2 | 600 |
| Native mobile app | 2,500 | 1 | 50% | 12 | 104 |
| Single sign-on | 150 | 3 | 80% | 6 | 60 |
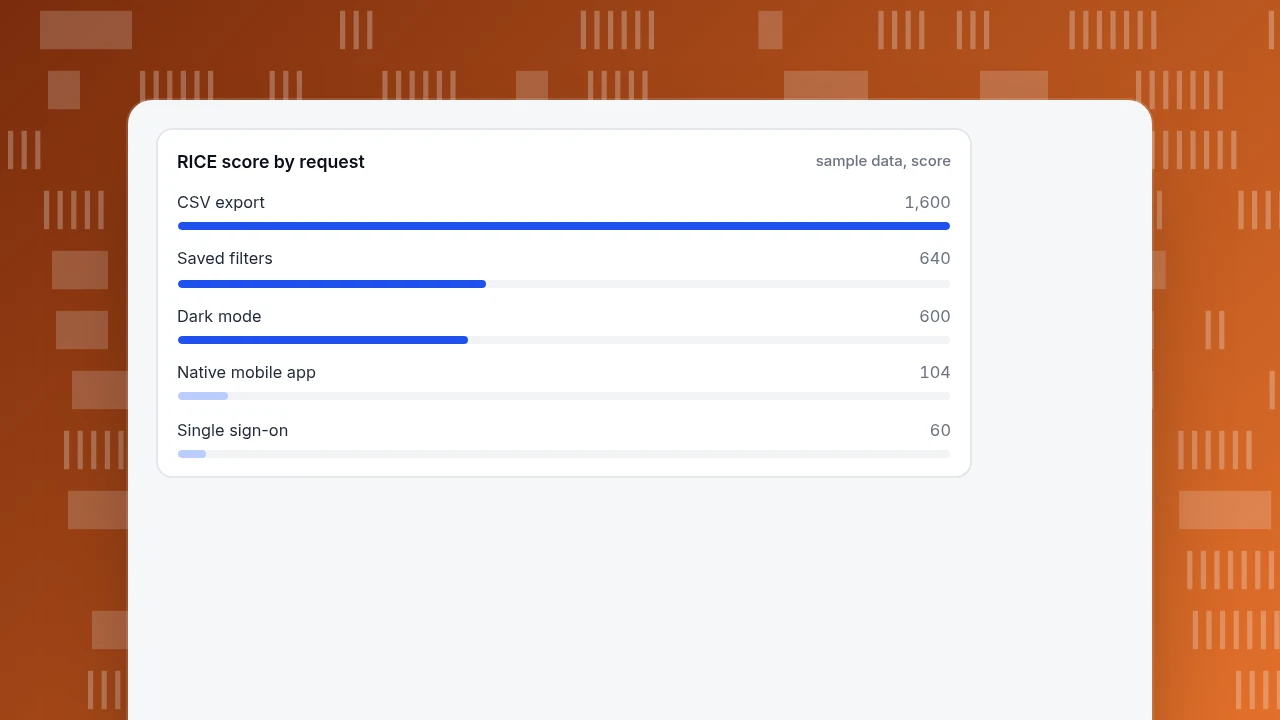
Check the first row: 800 × 2 × 1.0 ÷ 1 = 1,600. The fourth: 2,500 × 1 × 0.5 ÷ 12 = 104.2. The order is CSV export, saved filters, dark mode, mobile app, single sign-on.
Read the table for what it shows, not only the order. Single sign-on has the largest impact per person (3) but reaches 150 people and costs six person-months, so it scores 60. That does not mean enterprise customers are unimportant. It means that, on these inputs, you would need strong evidence that single sign-on blocks deals before it beats CSV export. That evidence belongs in Confidence, or in a different decision altogether (a contract-driven commitment, not a score).
RICE score by request
sample data, scoreHow do you test whether the ranking is stable?
An estimate that changes the winner is the estimate to check. Re-run the table with the most doubtful input changed, one change at a time, and see whether the order moves. On the sample data:
- CSV export takes twice as long (effort 1 → 2): the score halves to 800, still first. The winner is robust.
- Dark mode turns out easy (effort 2 → 1): the score doubles to 1,200 and it moves from third to second, ahead of saved filters (640).
- Single sign-on reach is really 400 accounts and confidence rises to 100%: 400 × 3 × 1.0 ÷ 6 = 200. It climbs from fifth to fourth, overtaking the mobile app (104).
- The mobile app's confidence rises from 50% to 80%: 2,500 × 1 × 0.8 ÷ 12 = 166.7, so, taken on its own, it would hold fourth place.
The rule: if halving or doubling one estimate does not change the top three, stop estimating and decide. If it does, spend the next hour measuring that one input (usually Reach) rather than debating the formula.
Why does the number of requests mislead you?
Request counts reward the loudest channel. Suppose the log shows 40 mentions of dark mode and 12 of single sign-on. Sorted by mentions, dark mode wins by more than three to one. Divide each by the people it could affect and the picture reverses:
- Dark mode: 40 mentions ÷ 3,000 active users = 1.3% of the base has said anything.
- Single sign-on: 12 mentions ÷ 150 accounts that could plausibly use it = 8.0% of that group.
Mentions measure how easy it is to ask, not how many people are affected. Reach should come from product data: how many distinct users touched the area the request is about last quarter. If 800 users exported a table last quarter and 40 of them asked for a better export, Reach is 800, and the 40 are evidence that the problem is felt, not the size of it.
How do you say no without losing the customer?
Every request gets one of three answers, and the requester should hear which one:
| Answer | Meaning | Reply that works |
|---|---|---|
| Planned | Scored high, scheduled | "We're building this; I'll tell you when it ships" |
| Not now | Scored low or blocked, but the problem is real | "I've logged what you're trying to do. It doesn't beat what's in progress right now; I'll revisit it on [date]" |
| Won't do | Conflicts with the product's direction | "We're not going to build this because [reason]. Here is what other customers do instead" |
Sample reply for a "Not now": "Thanks for explaining that you need to hand a monthly report to your finance team. Today there is no scheduled export, and it is not in this quarter's plan. I've recorded your use case with the others and will review the list on 15 January. Until then, the table download covers the one-off version."
Three details keep these replies from sounding like a brush-off: name the problem you heard, state the trade-off in one clause, and give a date to review, then actually review on that date.
How do you check afterwards that the feature worked?
Scoring happens before the work, so close the loop with a number. When you ship, write down the metric the Impact estimate assumed (for instance, "share of active users who export in a month") and its value before the release. Compare the same metric four weeks after. If Impact was scored 2 (high) and the metric did not move, your impact scale needs recalibrating for the next round, which is a better use of a retrospective than arguing about the winner.
Common mistakes in feature request management
- Scoring the proposal instead of the problem. If two requests describe the same problem, score once and consider both solutions.
- Treating Confidence as optimism. Use 50% when the evidence is one conversation, and mean it.
- Mixing effort units. Person-months for one request and T-shirt sizes for another produce a meaningless score.
- Letting one large account set Reach. One customer's 10,000 seats is a deal, not a reach figure; handle it as a commitment.
- Never saying no. An unanswered request log grows until nobody reads it.
How to support feature request scoring in TapCub
TapCub does not manage feature requests, run voting boards or publish a roadmap; it is where you get the numbers that make the scoring honest. The five-request example above would run like this:
- Collect the evidence in conversations. In Live chat › Inbox, each conversation arrives with the visitor's source, current page and recent browsing, and a link to their profile in analytics, so you can record Who and the page where the problem happened without asking.
- Measure Reach. In All-platform analytics › Behavior › Event analysis, count the distinct users who triggered the event behind the request (for example the export event) over the last 90 days. That is the Reach number, in users per quarter.
- Estimate Impact from the funnel. In All-platform analytics › Behavior › Behavior analysis, build a funnel through the flow the request is about. The step with the biggest drop is flagged, and the step conversion tells you how much room a fix has.
- Mark the release. Add an annotation under Configuration › Annotations on the release day so the before-and-after comparison is read against a labelled date.
- Re-check after four weeks. Open the same event analysis or funnel with a date range that starts at the annotation, and compare it with the baseline you wrote down.
TapCub does not score, rank or answer requests; the formula stays in your own spreadsheet, and TapCub supplies Reach and the before-and-after metric.
FAQ
What is a feature request?
A feature request is a proposed solution to a problem, raised by a customer, colleague or user. Record the problem, who has it, how often and what they do today. The proposed feature is a note, because the same problem may have a cheaper fix than the one suggested.
How do you prioritise feature requests?
Score each one on Reach, Impact, Confidence and Effort, using fixed scales, then rank by Reach × Impact × Confidence ÷ Effort. Test the ranking by doubling or halving the most doubtful input, and decide when the top three do not change.
How many feature requests should you build?
Build the ones that score highest until capacity is used, not a fixed number. Keep a share of each cycle for reliability and bug work, because requests compete with that work too; the score only compares requests with each other.
How do you say no to a feature request?
Say which answer it is (planned, not now, won't do), name the problem you heard, give the trade-off in one clause, and set a review date. A dated "not now" is more honest than silence and costs less than a vague "maybe".
Should you rank requests by votes?
Not alone. Votes show how easy something is to ask for, and they favour the loudest channel. Use them as evidence for Confidence and pair them with Reach measured from product usage.
Sources
- Intercom, "RICE: Simple prioritization for product managers": definitions of Reach, Impact (3 / 2 / 1 / 0.5 / 0.25), Confidence (100% / 80% / 50%) and Effort in person-months. https://www.intercom.com/blog/rice-simple-prioritization-for-product-managers/ (checked 2026-11-20)
- Atlassian, RICE template: formula (reach × impact × confidence) ÷ effort with Impact and Effort on a 1–5 scale. https://www.atlassian.com/software/confluence/templates/rice (checked 2026-11-20)
- Nielsen Norman Group, "Stop Solutioneering": ask questions before jumping to a solution. https://www.nngroup.com/videos/stop-solutioneering/ (checked 2026-11-20)
Was this article helpful?
We use your answers to fix and expand this page.
Couldn’t send. Please try again in a minute.
Thanks for the feedback. We’ll use it to improve this page.You’ve already sent feedback on this page. Thanks.

Technical Engineer
Focuses on tracking code, SDKs, and API integrations, with practical guidance on implementation checks and troubleshooting.