Try it on your own data
Every report in this article is in the free plan. One snippet for web and apps, up to 10 sites.
Start freeLead generation metrics measure how many leads you produce, how good they are, what they cost and how fast they move toward revenue. Read them in pairs: volume with quality, cost with sales cycle. Optimise any one number alone and the funnel bends out of shape. In the example below, a lower cost per lead cuts customers from 15 to 9.6.
What you will learn
- Group lead metrics into volume, quality, cost and speed, and put each next to a partner metric that moves the other way
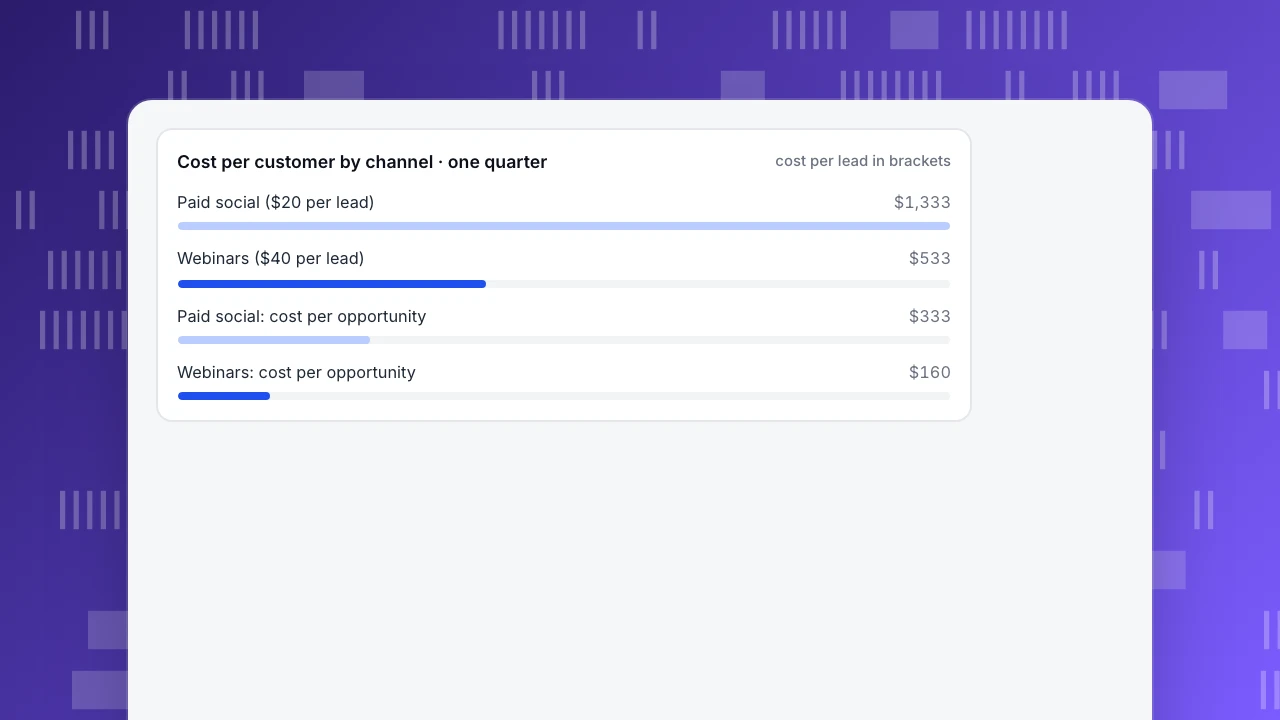
- Cheaper leads can be expensive customers: $20 leads became $1,333 customers, $40 leads $533 customers
- Set targets on cost per opportunity or per customer and report by lead cohort, not on cost per lead alone
What lead generation metrics should you track?
Lead generation metrics are the numbers that tell you how many leads you produce, how good they are, what they cost and how fast they move toward revenue. Most lists give you 15 to 30 of them. You need fewer, grouped into four kinds, because each kind answers a different question:
- Volume — are we producing enough? New leads, and lead velocity rate (month-over-month growth in qualified leads).
- Quality — are they the right leads? Lead-to-MQL or MQL-to-SQL rate, lead-to-opportunity rate, opportunity win rate.
- Cost — what are we paying? Cost per lead, cost per opportunity, customer acquisition cost.
- Speed — how fast do they move? Time to first response, days from lead to opportunity, sales cycle length.
The stage names matter less than using the same ones everywhere. Google's own recommended events for lead generation are a useful reference: a lead is generated (form submitted), qualified or disqualified, worked (contacted by a representative), and finally closed as converted or not converted. Map your CRM stages onto a sequence like that once, and every metric below has a clear numerator and denominator. Definitions of the qualification stages are in marketing qualified lead and sales qualified lead.
The table below lists each metric with its formula and the metric it should always be read next to. That last column is the point of this article.
| Group | Metric | Formula | Pair it with |
|---|---|---|---|
| Volume | New leads | Leads created in the period | Lead-to-opportunity rate |
| Volume | Lead velocity rate | (Qualified leads this month − last month) ÷ last month | Win rate |
| Quality | MQL-to-SQL rate | SQLs ÷ MQLs | MQL volume |
| Quality | Lead-to-opportunity rate | Opportunities ÷ leads, same cohort | New leads |
| Quality | Win rate | Deals won ÷ opportunities closed | Sales cycle length |
| Cost | Cost per lead | Spend ÷ leads | Cost per opportunity |
| Cost | Cost per opportunity | Spend ÷ opportunities | Win rate |
| Cost | Customer acquisition cost | Spend ÷ new customers | Lead-to-close days |
| Speed | Time to first response | Median time from submission to first human contact | Share of leads reaching a meeting |
| Speed | Lead-to-opportunity days | Median days from lead to opportunity | Lead-to-opportunity rate |
| Speed | Sales cycle length | Median days from opportunity to close | Customer acquisition cost |
Compute quality rates by lead cohort (the month the lead arrived), not by dividing this month's deals by this month's leads.
Why should lead metrics be read in pairs?
Every single lead metric can be improved by making the funnel worse somewhere else. Cost per lead falls if you buy cheaper, lower-intent leads. Conversion rates rise if you send fewer, safer leads to sales. Response time improves if reps send a templated email in two minutes and never follow up. A metric read alone invites exactly the behavior that games it.
The fix is to read lead metrics in pairs, where pushing one number up tends to push the other down. Four pairs cover most decisions:
- Volume with quality — new leads next to lead-to-opportunity rate. If leads rise and the rate falls, you bought volume, not pipeline. If both rise, the channel is working.
- Cost with quality — cost per lead next to cost per opportunity. A cheap lead that rarely becomes an opportunity is expensive where it counts.
- Cost with cycle — customer acquisition cost next to days from lead to close. A channel with a slightly higher CAC that closes in half the time returns cash sooner and frees sales capacity.
- Speed with outcome — time to first response next to the share of leads that reach a meeting. Fast replies that do not lead anywhere are a template problem.
The rule for reports: never put a volume or cost number on a dashboard without its partner beside it. If a dashboard only has room for one number per channel, use cost per opportunity or cost per customer, since they already combine cost and quality.
Worked example: two channels, one quarter
Sample data: a B2B company runs two lead sources for one quarter. Opportunities and closed deals come from the CRM.
Paid social
- Spend $8,000, leads 400: cost per lead 8,000 ÷ 400 = $20.
- Opportunities 24: lead-to-opportunity 24 ÷ 400 = 6%.
- Won 6: win rate 6 ÷ 24 = 25%; lead-to-customer 6 ÷ 400 = 1.5%.
- Cost per opportunity 8,000 ÷ 24 = $333; cost per customer 8,000 ÷ 6 = $1,333.
- Median days from lead to opportunity: 21.
Webinars
- Spend $4,800, leads 120: cost per lead 4,800 ÷ 120 = $40.
- Opportunities 30: lead-to-opportunity 30 ÷ 120 = 25%.
- Won 9: win rate 9 ÷ 30 = 30%; lead-to-customer 9 ÷ 120 = 7.5%.
- Cost per opportunity 4,800 ÷ 30 = $160; cost per customer 4,800 ÷ 9 = $533.
- Median days from lead to opportunity: 9.
Read one metric at a time and the answer changes with the metric. On volume, paid social wins 400 to 120. On cost per lead, paid social wins $20 to $40. On every quality, cost-per-outcome and speed metric, webinars win: four times the lead-to-opportunity rate, half the cost per opportunity, 40% of the cost per customer (533 ÷ 1,333), and opportunities in 9 days instead of 21.
Read in pairs, the picture is consistent. Volume with quality: paid social brings more leads but far fewer of them become opportunities. Cost with quality: the $20 lead becomes a $333 opportunity, the $40 lead a $160 one. Cost with cycle: webinars are cheaper per customer and faster. You can calculate the per-lead figures for your own channels with the cost per lead calculator.
Cost per customer by channel · one quarter
cost per lead in bracketsWhat happens if you optimise only one number?
Suppose the team's target for next quarter is cost per lead, and someone proposes moving the whole webinar budget into paid social, which "costs half as much per lead". Assume paid social keeps its rates at the higher spend (in practice they usually get worse as you scale, so this is the optimistic case).
- Paid social now gets $8,000 + $4,800 = $12,800. The extra $4,800 at $20 per lead buys 4,800 ÷ 20 = 240 more leads.
- Those 240 leads produce 240 × 6% = 14.4 opportunities and 14.4 × 25% = 3.6 customers.
- Total customers: 6 + 3.6 = 9.6, down from 6 + 9 = 15.
On the target metric, the move is a success: blended cost per lead falls from 12,800 ÷ 520 = $24.62 to 12,800 ÷ 640 = $20.00, and lead volume grows from 520 to 640, up 23%. On the metric that pays salaries, it is a failure: customers fall by 36% and customer acquisition cost rises from 12,800 ÷ 15 = $853 to 12,800 ÷ 9.6 = $1,333.
This is what "pushing the funnel out of shape" looks like. Nobody made a mistake on the number they were asked to improve. The number was simply unpaired. Had the target been cost per opportunity, the same proposal would have been rejected on the spot, because paid social's $333 is more than twice webinars' $160.
Two caveats keep this honest. Channel rates are not fixed: webinars may not scale either, and a quarter of data with 6 and 9 closed deals is a small sample, so read it as a direction, not a forecast. And the deals come from the CRM; how to compute lead-to-customer conversion carefully, including the time lag between lead and close, is in lead conversion rate.
How do you measure lead velocity and speed?
Lead velocity rate (LVR) is month-over-month growth in qualified leads: (qualified leads this month − qualified leads last month) ÷ qualified leads last month. With 130 qualified leads this month and 115 last month, LVR = (130 − 115) ÷ 115 = 13.0%. It is a leading indicator: qualified leads today become pipeline next month. Pair it with win rate, because LVR built by loosening the qualification rule will show up as a falling win rate a month or two later.
Time to first response is the time from a lead's submission to the first human contact. Response speed matters for web leads: a 2011 Harvard Business Review study by Oldroyd, McElheran and Elkington audited 2,241 US companies and found only 37% responded to a web lead within an hour, while 23% never responded at all. Track the median and the share answered within your target window, such as one business day, rather than an average that a few very late replies can distort.
Days from lead to opportunity and sales cycle length tell you when to judge a channel. If the median lead takes 21 days to become an opportunity and another 45 to close, a channel launched three weeks ago cannot be judged on customers yet. Report by lead cohort: group leads by the month they arrived and follow each cohort's opportunity and win rates over time, instead of dividing this month's deals by this month's leads, which mixes different cohorts. Following each lead from source to closed deal is covered in lead tracking.
How often should you report lead generation metrics?
Match the cadence to how fast each metric can actually change:
| Cadence | Metrics | Decisions |
|---|---|---|
| Weekly | New leads by channel, time to first response, leads with no owner | Fix routing and follow-up; no channel judgments |
| Monthly | Cost per lead with lead-to-opportunity rate, lead velocity rate, cost per opportunity | Shift spend between campaigns inside a channel |
| Quarterly | Cost per customer, win rate, lead-to-close days, by lead cohort and channel | Move budget between channels; revise qualification rules |
Weekly numbers are too noisy for channel decisions: a channel with 6 deals a quarter has, on average, fewer than one deal every two weeks. Leave budget moves to the quarterly review, when the cohort has had time to close.
What are the most common lead metric mistakes?
- Reporting lead volume alone. It rewards the cheapest, lowest-intent sources. Always show lead-to-opportunity next to it.
- Setting cost per lead as the target. As the example shows, it can raise CAC by more than half while looking like a win.
- Mixing cohorts. Dividing this quarter's customers by this quarter's leads credits old leads to new campaigns. Use lead cohorts.
- Changing the qualification rule silently. A looser MQL definition inflates volume and velocity overnight. Log every rule change with its date.
- Averaging response time. One lead answered after two weeks hides behind fifty answered in minutes. Use the median and the share within target.
- Judging new channels too early. Wait at least one full lead-to-close cycle before calling a channel good or bad.
How to track lead generation metrics in TapCub
TapCub covers the top of this funnel — leads, their sources and their cost — and the behavior around them. It is not a CRM: opportunities, win rates and deal stages live in your CRM, and TapCub does no lead scoring. For the two-channel example:
- Count leads as goals. In Web analytics › Goals, create a goal on your form-submit event (or the thank-you page), then break it down by source to get new leads per channel. The goal conversion rate here divides by unique visitors, not sessions. Bots are counted separately in Web analytics › Bots, so crawler traffic does not dilute the rate.
- Put spend next to it. Import spend by day, channel, source and campaign in All-platform analytics › Business › Channel ROI (CSV or one row at a time). Channel ROI's own cost per acquisition counts purchases, so for cost per lead divide each channel's spend by its lead-goal conversions — $8,000 ÷ 400 = $20 for paid social in the example.
- Add chat leads. If you run live chat, offline messages collect an email and a question when nobody is online, and Live chat › Reports › Conversion attribution compares the goal conversion of visitors who chatted with those who did not. Capture tactics are in live chat lead generation.
- Follow B2B accounts, not just people. After
tapcub.login, calltapcub.group('company', id, {...}); All-platform analytics › Users › Accounts shows each account's members, 30-day activity and a 0–100 health score, useful context when sales asks which leads are still engaged. - Join the rest in your CRM. Opportunities, win rate, cost per opportunity and lead-to-close days need CRM stages; combine them with the lead and spend numbers above, by lead cohort, in your quarterly review.
FAQ
What are the most important lead generation metrics?
Track one or two from each of four groups: volume (new leads, lead velocity rate), quality (lead-to-opportunity rate, win rate), cost (cost per lead, cost per opportunity, customer acquisition cost) and speed (time to first response, lead-to-close days). If you can only watch one per channel, use cost per opportunity or cost per customer, because each already combines cost with quality.
How do you calculate cost per lead?
Divide the spend on a channel or campaign by the number of leads it produced in the same period: $8,000 ÷ 400 leads = $20. Include ad spend and any direct costs such as webinar platforms or content production if you want a full picture. Then read it next to cost per opportunity, because a cheap lead that rarely converts is expensive where it matters.
What is lead velocity rate?
Lead velocity rate is the month-over-month growth in qualified leads: (this month − last month) ÷ last month. With 130 qualified leads this month and 115 last month, LVR is 13.0%. It is a leading indicator of future pipeline. Pair it with win rate, since loosening the qualification rule can raise LVR while lowering the share of leads that close.
What is the difference between lead generation KPIs and metrics?
Metrics are everything you can measure about leads; KPIs are the few metrics tied to a target that the team is accountable for. A good set of lead generation KPIs pairs a volume or cost KPI with a quality KPI, such as leads with lead-to-opportunity rate, so hitting one target cannot quietly damage the other part of the funnel.
How often should you review lead generation metrics?
Weekly for operational checks such as lead volume, routing and response time; monthly for cost per lead, lead-to-opportunity rate and lead velocity; quarterly for cost per customer, win rate and budget moves between channels. Judge channels by lead cohort only after at least one full lead-to-close cycle, so slow-closing sources are not cut before their deals arrive.
See also: B2B Lead Generation: Judge Channels by Won Deals, Not Lead Count.
Sources
- Google Analytics Help. Recommended events — lead generation events from generate_lead to close_convert_lead. Verified 2026-11-15.
- Oldroyd, McElheran & Elkington. The Short Life of Online Sales Leads. Harvard Business Review, March 2011 — response-time audit of 2,241 US companies. Verified 2026-11-15.
Was this article helpful?
We use your answers to fix and expand this page.
Couldn’t send. Please try again in a minute.
Thanks for the feedback. We’ll use it to improve this page.You’ve already sent feedback on this page. Thanks.

Product Experience Specialist
Explores usability, user journeys, and feature adoption through practical examples of onboarding and everyday product use.