Try it on your own data
Every report in this article is in the free plan. One snippet for web and apps, up to 10 sites.
Start freeThe difference between metrics and KPIs is commitment. Every KPI is a metric, but a metric only becomes a KPI when it is tied to a goal with a target, has one owner, and has a threshold that triggers a defined action. That commitment is costly, so three to five per team is enough. Below: four questions to test any metric, a worked 12-to-4 shortlist and how to calculate an alert threshold.
What you will learn
- A KPI is a metric with a target, one owner and a threshold that triggers action
- Keep three to five KPIs per team; demote the rest to supporting metrics
- Separate the target from the alert threshold; set the alert from normal variation
What is the difference between metrics and KPIs?
A metric is any number you measure: pageviews, signups, tickets, revenue, average session length. A key performance indicator (KPI) is a metric that has been promoted. Three things are attached to it that an ordinary metric does not have: a goal with a target, a named owner, and a threshold that triggers a specific action when it is crossed. Every KPI is a metric; most metrics are not KPIs, and should not be.
Are KPIs metrics? Yes, always. The difference is not the kind of number but the commitment around it. "Trial-to-paid conversion rate" is a metric in an analytics tool. It becomes a KPI when the growth lead owns it, the target is 12% a week, and a drop below 10.7% two weeks running means the team stops other work to find out why.
That commitment is expensive, which is why a team can only afford a few KPIs. Kaplan and Norton's balanced scorecard, written for senior management, made the same point in 1992: limit the number of measures so attention goes to the ones that matter. Most teams end up with three to five. The rest of their metrics are still useful, as diagnostics you open when a KPI moves, not as numbers anyone has to react to.
The table below compares the two on the things that actually differ in practice: how many you have, who owns them, how often anyone looks, and what happens when they move.
| Aspect | Metric | KPI |
|---|---|---|
| Definition | Any number you measure | A metric tied to a goal, an owner and an action threshold |
| How many | Dozens or hundreds | 3–5 per team |
| Owner | Often none | One named person |
| Review cadence | When needed, to diagnose | Every review, on a fixed rhythm |
| When it moves | Someone may look | A written rule says who does what |
| Example | Pageviews, bounce rate | Trial-to-paid ≥ 12% weekly; two weeks < 10.7% triggers a review |
The same number can be a KPI for one team and a supporting metric for another.
Four questions that decide whether a metric is a KPI
Ask these about any candidate. A KPI needs four yeses.
- Is it tied to a goal with a target? "Grow revenue" is a goal; "trial-to-paid at 12% or higher each week" is a target. If you cannot write the target as a number and a date, it is not ready to be a KPI.
- Does one person own it? Ownership means they explain movements and decide responses. Shared ownership across marketing, product and sales usually means nobody acts. If the metric needs two owners, split it into two metrics.
- Is there a threshold that triggers a defined action? Write the rule down: "if it falls below X for two weeks, we do Y." A number that would not change anyone's plan whether it went up or down by 20% is a metric to watch, not a KPI. This is the test most candidates fail, and the one that distinguishes actionable metrics from vanity metrics.
- Can the owner influence it within the review cycle? If the team reviews weekly but the number reacts over quarters, the owner can only watch it. Pair a slow, lagging outcome with a faster leading metric the team can move; leading vs lagging indicators covers how to pick the pair.
A metric that passes three of four often makes a good supporting metric: the first thing you check when a KPI moves.
Worked example: from 12 metrics to 4 KPIs
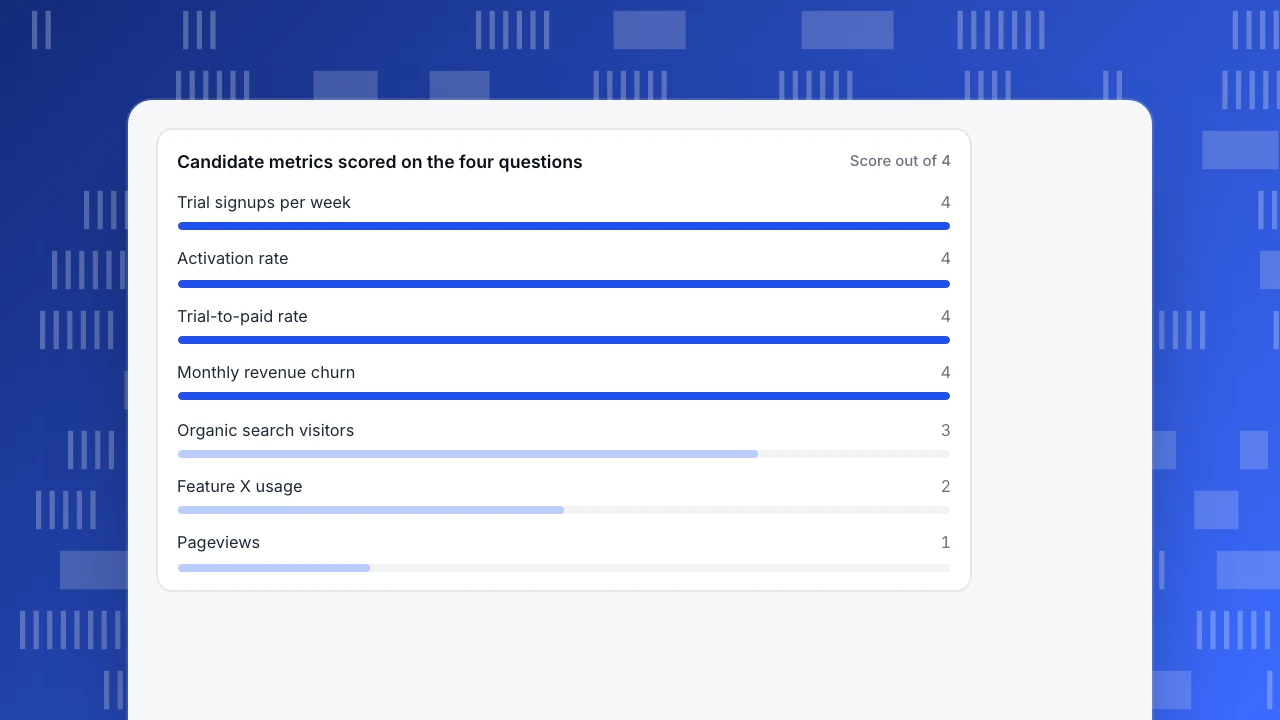
Sample data. A SaaS growth team tracks 12 metrics on its dashboard. It scores each against the four questions (Y = yes):
| Metric | Goal and target | One owner | Threshold → action | Influence weekly | Score |
|---|---|---|---|---|---|
| Trial signups per week | Y | Y | Y | Y | 4 |
| Activation rate (first project in 7 days) | Y | Y | Y | Y | 4 |
| Trial-to-paid conversion rate | Y | Y | Y | Y | 4 |
| Monthly revenue churn | Y | Y | Y | Y | 4 |
| Visitors from organic search | Y | Y | N | Y | 3 |
| Support tickets per week | N | Y | Y | N | 2 |
| Feature X usage | Y | N | N | Y | 2 |
| Social followers | N | Y | N | Y | 2 |
| Email open rate | N | Y | N | Y | 2 |
| Pageviews | N | N | N | Y | 1 |
| Bounce rate | N | N | N | Y | 1 |
| Average session duration | N | N | N | Y | 1 |
Four metrics score 4 of 4 and become the team's KPIs: signups (owner: marketing lead), activation (product manager), trial-to-paid (growth lead) and revenue churn (head of customer success, reviewed monthly). Together they trace the path from first visit to retained revenue, which is the shape a metric tree would give you.
Organic visitors scores 3. It stays on the dashboard as the first diagnostic for signups. Support tickets belong to the support team's KPI set, not growth's. The six metrics scoring 1 or 2 move to a monthly report: they explain changes but do not trigger action on their own.
The dashboard went from 12 numbers to 4 headline KPIs and one supporting metric. Weekly reviews now discuss four numbers instead of skimming twelve.
Candidate metrics scored on the four questions
Score out of 4How to set a KPI threshold
A KPI needs two numbers, and teams often confuse them. The target is where you want to be. The alert threshold is where normal variation ends and something has probably changed. Setting the alert at the target means every slightly below-target week triggers an investigation.
A practical way to set the alert threshold comes from statistical process control. NIST's engineering statistics handbook describes control limits as the mean plus or minus a multiple of the standard deviation, typically three. Points beyond three standard deviations happen by chance about 0.27% of the time if nothing has changed. Many teams also use a warning line at two standard deviations.
Sample data. The growth team's trial-to-paid rate over the last eight weeks, on roughly 2,000 trials a week:
12.0%, 11.5%, 12.5%, 13.0%, 11.0%, 12.0%, 12.5%, 11.5%
- Mean: 96.0 ÷ 8 = 12.0%.
- Sample standard deviation: 0.65 points.
- Warning line: 12.0 − 2 × 0.65 = 10.7%.
- Action line: 12.0 − 3 × 0.65 = 10.0%.
The rule the team writes down: one week below 10.0%, or two weeks in a row below 10.7%, and the growth lead opens an investigation that week. Anything between 10.7% and 12.0% is normal noise and gets no meeting. The target stays at 12% or higher; the thresholds tell you when a miss is real.
Recalculate the band each quarter, and after any change to how the metric is tracked. If the KPI is a count with strong weekly seasonality, compare each week with the same weekday pattern rather than a flat average.
How many KPIs does a team need?
Three to five per team, and one per owner is a useful ceiling. The constraint is attention: each KPI should get a few minutes of real discussion in every review, and a threshold breach should be rare enough that it gets a response. Ten KPIs reviewed weekly means either a two-hour meeting or ten numbers nobody really discusses.
At company level, one north star metric plus a handful of team KPIs that feed it usually works better than a long company scorecard. Each team's KPIs should connect to the level above: activation and trial-to-paid feed revenue growth; first response time and resolution rate feed retention.
A useful check: list each KPI with its owner and its action rule. If two KPIs have the same owner and the same action, merge them. If one has no action rule you can write in a sentence, demote it.
KPIs, metrics and OKRs: where each fits
Metrics measure everything. KPIs are the few metrics that track whether the business is healthy, continuously, quarter after quarter. OKRs (objectives and key results) are time-boxed goals for change: "raise activation from 38% to 45% this quarter." A key result is often a KPI with a stretch target for one period.
In practice, KPIs run all the time with thresholds; OKRs come and go each quarter and push a few KPIs to a new level. The full comparison, including how to keep the two from duplicating each other, is in OKR vs KPI.
Common mistakes when choosing KPIs
- Promoting vanity metrics. Pageviews and followers rise easily and rarely change a decision. If a 20% move would not change your plan, it is not a KPI.
- KPIs without owners. A KPI owned by "the team" gets discussed and not acted on.
- Target used as the alert. Every slightly below-target week becomes a fire drill. Separate the target from the threshold.
- Only lagging KPIs. Revenue and churn confirm what already happened. Pair each with a leading metric the owner can move this week.
- Changing the definition silently. If the denominator changes from sessions to visitors, the trend breaks. Record the date and restate history where you can.
- Gaming. When a number is tied to rewards, people find ways to move the number instead of the outcome. Anthropologist Marilyn Strathern's phrasing of Goodhart's law is "When a measure becomes a target, it ceases to be a good measure." Pair each KPI with a guardrail, such as activation with refund rate.
- Too many KPIs. More than five per team dilutes attention; the KPI dashboard guide shows how to lay out the few you keep.
How to set up KPIs and alerts in TapCub
Here is how the trial-to-paid KPI from the example would be defined and watched in TapCub, so the threshold rule runs without someone checking a chart every morning.
- Define the metric once. In All-platform analytics › Behavior › Metrics & SQL, create a formula metric such as unique people who paid divided by unique people who started a trial, formatted as a percent. Saved metrics can be reused across analyses, and the editor previews the last 28 days before you save.
- Track the goal events. If the KPI is a conversion, set it up in Web analytics › Goals as an event or page goal. The goal conversion rate divides by unique visitors in the selected dates, which you should note in the KPI definition.
- Turn the threshold into a monitor. In All-platform analytics › Operations › Monitors, pick the saved metric and a condition: a fixed threshold (below 10.0%), a percent change versus the previous period, a forecast band or an anomaly band based on the same weekday over 28 days. A dry run calculates without sending and tells you how many times the rule would have fired in the last 30 days, so you can see whether 10.7% is too noisy before anyone gets paged.
- Send it to the owner. Monitors notify through the channels set up in Configuration › Settings › Notifications, such as WeCom, DingTalk, Feishu or a webhook with a Slack template. By default the same monitor does not repeat for about 60 minutes, and three hits in a row pause it.
- Keep the action human. A monitor only notifies; it does not change anything for you. The owner and the action rule from the four questions are still yours to write down.
FAQ
Are KPIs metrics?
Yes. Every KPI is a metric, but only a few metrics are KPIs. A metric becomes a KPI when it is tied to a goal with a numeric target, has one owner, and has a threshold that triggers a defined action. Without those three, it is a useful number to monitor or diagnose with, but nobody is committed to responding when it moves.
What is an example of a metric versus a KPI?
Pageviews is a metric: it is measured, but no one changes plans when it moves 10%. Trial-to-paid conversion rate becomes a KPI when the growth lead owns it, the target is 12% a week, and two weeks below 10.7% triggers an investigation. The same number can be a KPI for one team and a supporting metric for another.
How many KPIs should a team have?
Three to five per team is a practical range, with no more than one or two per owner. Each KPI should get real discussion in every review and a response when it crosses its threshold. If you have ten, either the review becomes very long or several KPIs are skimmed, which turns them back into ordinary metrics.
How do you set a threshold for a KPI?
Separate the target from the alert. Take eight or more recent periods, calculate the mean and standard deviation, and set a warning line at two standard deviations from the mean and an action line at three. In the example, a 12.0% mean with a 0.65-point standard deviation gives 10.7% and 10.0%. Recalculate quarterly or after tracking changes.
What is the difference between KPIs and OKRs?
KPIs track ongoing health and run continuously with thresholds. OKRs are time-boxed objectives for change, usually set quarterly, with key results that measure progress. A key result often takes an existing KPI and sets a stretch target for one quarter, such as raising activation from 38% to 45%. When the quarter ends, the KPI keeps running.
Sources
- Kaplan, R. S. & Norton, D. P. (1992). The Balanced Scorecard — Measures That Drive Performance. Harvard Business Review.
- NIST/SEMATECH. e-Handbook of Statistical Methods, 6.3.1: What are control charts? and 6.3.2: What are variables control charts?
- Strathern, M. (1997). 'Improving ratings': audit in the British University system. European Review, 5(3), 305–321.
Was this article helpful?
We use your answers to fix and expand this page.
Couldn’t send. Please try again in a minute.
Thanks for the feedback. We’ll use it to improve this page.You’ve already sent feedback on this page. Thanks.

Product Analyst
Focuses on event analysis, conversion funnels, and retention, using clear metric definitions and structured analysis to explain product performance.