Try it on your own data
Every report in this article is in the free plan. One snippet for web and apps, up to 10 sites.
Start freeTo minimize main thread work, first find which scripts own the long tasks (anything over 50 ms), then remove, defer or split them; compressing code comes last. A busy main thread shows up as slow interactions, measured by INP, and third-party scripts often own the largest share. Below: the audit, attribution, a worked example and real-user checks.
What you will learn
- A busy main thread shows up as slow interactions: judge the fix by field INP, not the Lighthouse score
- Attribute long tasks to their owners first; third-party scripts often hold the largest share
- Remove, defer and split before you minify; compression cuts bytes, not main-thread time
What "minimize main-thread work" means
The browser's main thread is where most of a page's work happens: parsing HTML, calculating styles, laying out and painting the page, and running JavaScript. It does one task at a time. Lighthouse's "Minimize main-thread work" audit flags a page that keeps the main thread busy for longer than 4 seconds during load, and breaks that time down by category.
Two terms make the rest of this guide precise:
- A long task is any task that runs longer than 50 milliseconds. While it runs, the page cannot respond to a tap, a click or a key press.
- The blocking period of a long task is its duration minus 50 ms. A 120 ms task has a 70 ms blocking period. Lighthouse adds up these blocking periods between first contentful paint and the page becoming reliably interactive and reports them as Total Blocking Time.
The audit tells you that the thread is busy. It does not tell you which script made it busy, and that is the question to answer before you change any code.
Why main-thread work shows up as slow interactions
Users rarely notice "main-thread work" during load. They notice that a button does nothing for half a second. That delay is what Interaction to Next Paint (INP) measures: the time from an interaction to the next frame the browser paints.
web.dev splits every interaction into three phases:
- Input delay: the wait before any event handler can start. If a long task is running when the user taps, the tap waits for it to finish.
- Processing duration: the time your event handlers take to run.
- Presentation delay: the time from the handlers finishing to the next frame appearing, which includes style, layout and paint.
Busy main threads inflate all three, input delay most of all. INP is good at 200 ms or less and poor above 500 ms, judged at the 75th percentile of real page loads, split by mobile and desktop. A page can pass Lighthouse on a fast laptop and still fail INP for phone users, because a phone CPU runs the same JavaScript several times slower.
The rule that follows: treat the Lighthouse audit as a pointer, and treat field INP as the result you are trying to move.
What counts as main-thread work
Lighthouse groups the busy time into six categories. Chrome's documentation pairs each with its own fixes:
| Category | What is in it | Typical fix |
|---|---|---|
| Script evaluation | Running JavaScript, including third-party tags | Remove or defer third-party code, debounce input handlers, move work to web workers |
| Script parsing and compilation | Turning downloaded JavaScript into runnable code | Code splitting, removing unused code |
| Style and layout | Recalculating styles and element positions | Simpler selectors, avoiding layout thrashing, smaller layouts |
| Rendering | Painting pixels and compositing layers | Animate compositor-only properties (transform, opacity), smaller paint areas |
| Parsing HTML and CSS | Reading markup and stylesheets | Inline critical CSS, defer the rest, keep the DOM small |
| Garbage collection | Freeing memory that scripts no longer use | Create fewer short-lived objects, watch memory growth |
On most JavaScript-heavy pages, script evaluation is the largest row; web.dev notes that parsing, compiling and executing JavaScript is often the biggest source of main-thread work. But "script evaluation" covers every script on the page, yours and everyone else's. The category alone does not say whose code to fix.
Find where the long tasks come from first
Spend ten minutes on attribution before touching code. The steps below use Chrome DevTools; any browser profiler works the same way.
- Record a realistic load. Open DevTools › Performance, set CPU throttling to 4x or 6x slowdown so a laptop behaves more like a mid-range phone, and record a reload. Then record a second trace in which you click the main controls, such as the menu, the filters and "Add to cart".
- Find the long tasks. In the Main track, long tasks are marked with a red corner. Note each one's duration and when it ran: during load, or right when you clicked.
- Group by origin. In the Bottom-up tab, group by domain. Every long task now has an owner: your bundle, a tag manager, an embedded widget, a testing script.
- Convert to blocking time. For each owner, add up (duration − 50 ms) across its long tasks. This is the number to rank by, because it is the part users feel.
- Check the field. Lab traces show one device on one network. For real visitors, the Long Animation Frames API can report which scripts ran during slow frames, so you can confirm the same owners appear in production.
Third-party code earns special attention in step 3. Tag managers, marketing pixels, review widgets and testing tools each run their own JavaScript on your main thread, and nobody on your team profiles them when they are added. Scripts also outlive their purpose: the campaign ends, the test is decided, and the tag stays.
Worked example: attributing 990 ms of blocking time
Sample data. A product page records these long tasks in a throttled lab trace:
| Owner | Long tasks (ms) | Blocking time (ms) |
|---|---|---|
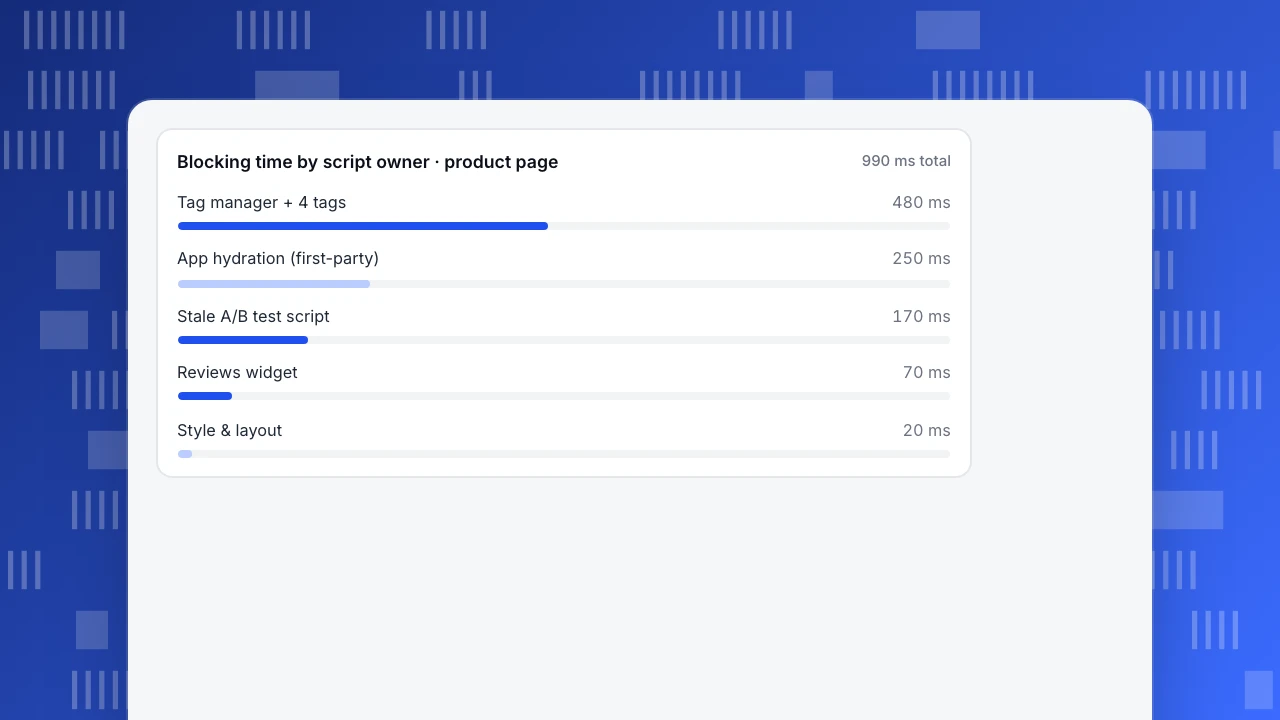
| Tag manager + 4 marketing tags | 310, 180, 140 | 260 + 130 + 90 = 480 |
| App hydration (first-party) | 260, 90 | 210 + 40 = 250 |
| A/B test script, test ended 3 months ago | 220 | 170 |
| Reviews widget | 120 | 70 |
| Style and layout after a web-font swap | 70 | 20 |
| Total | 1,390 ms of long tasks | 990 |
Third-party code owns 480 + 170 + 70 = 720 ms, or 72.7% of the blocking time. The site's own bundle owns 250 ms, 25.3%.
Now compare two plans.
Plan A, compress the code first. Minifying and tree-shaking the first-party bundle cuts its script time by an assumed 15%. The hydration tasks become 221 ms and 76.5 ms, with 171 + 26.5 = 197.5 ms of blocking. That saves 52.5 ms, about 5% of the total. Gzip or Brotli would cut download bytes but not main-thread time at all, because the browser decompresses before it parses.
Plan B, attribute and then split or defer.
- Delete the A/B script for the finished test: −170 ms.
- Remove two of the four marketing tags that nobody reads, and load the tag manager after the page has loaded. What remains is one 150 ms task, which still blocks for 100 ms but no longer during load.
- Load the reviews widget only when its section scrolls into view. Its 120 ms task still blocks for 70 ms, just later and only for visitors who scroll there.
- Split hydration into chunks under 50 ms by yielding to the main thread between components. The same 350 ms of work now produces no blocking time.
- Leave the 20 ms of style and layout for later.
Blocking time after Plan B: 100 + 70 + 20 = 190 ms, an 80.8% reduction, and only the 20 ms style task is left inside the load window. The ordering, not the effort, made the difference: Plan A worked on the 25% slice, Plan B started with the 73% one.
Blocking time by script owner · product page
990 ms totalFixes in order of payoff
Work down this list. Each step is cheaper per millisecond saved than the one after it.
- Remove scripts that no longer earn their place. Finished tests, retired pixels, duplicate analytics. Deleting is the only fix that removes the work instead of moving it.
- Defer or lazy-load third-party code. Load scripts with
asyncordefer, start non-essential tags after the load event, and load embeds such as maps, videos and review widgets when they near the viewport. A static placeholder that loads the real embed on click (often called a facade) keeps heavy players off the main thread entirely until someone wants them. - Split your own long tasks. Break loops and initialisation into chunks, and yield between them so input can run.
await scheduler.yield()continues your work ahead of other queued tasks where it is supported; a promise wrapped aroundsetTimeoutis the fallback. Keep each chunk under 50 ms. - Make event handlers do less. Do the visible update first, such as opening the menu or showing the spinner, and push analytics calls and non-visual work to after the next paint.
- Move computation off the main thread. Parsing large JSON, filtering big lists and image processing can run in a web worker, which cannot touch the DOM but also cannot block it.
- Shrink style, layout and DOM work. Avoid reading layout properties right after writing styles in a loop, keep the DOM size reasonable, and animate with
transformandopacity. - Then reduce bytes. Code splitting and removing unused code reduce parse and compile time. Minification helps a little. Compression helps download time, not the main thread.
The table after this section maps each source of long tasks to its fix.
| Where the long task comes from | Fix | Effect on main-thread time |
|---|---|---|
| Script for a finished test or retired campaign | Delete it | Work removed entirely |
| Tag manager and marketing tags | Remove unused tags; load the rest after the load event | Moved out of the load window; fewer tasks |
| Embeds (maps, video, reviews) | Lazy-load near the viewport or load on click | Runs later, only for visitors who need it |
| Your own initialisation or hydration | Split into chunks under 50 ms and yield between them | Same work, little or no blocking time |
| Heavy event handlers | Paint the visible update first, defer the rest | Shorter input delay and processing time |
| Large computations | Move to a web worker | Off the main thread |
| Unused code in your bundle | Code splitting, remove dead code | Less parse and compile time |
Order matters: rows near the top remove or move the most work per hour spent.
Why compressing code comes last
"Reduce JavaScript" advice often blurs two different costs. Network cost is bytes over the wire, and compression and minification cut it. Main-thread cost is the time to parse, compile and run the code, and only shipping less code or running less of it cuts that.
A 400 KB bundle that Brotli shrinks to 100 KB still has to be decompressed back to 400 KB and parsed on the main thread. If the slow part of your page is a 300 ms task inside a third-party tag, no build setting in your own repository touches it. That is why the order is attribution first, then removing, deferring and splitting, and compression last. Compression is still worth doing, just not as the fix for this audit.
Check that real users got faster
A cleaner Lighthouse report proves the lab trace improved. It does not prove that visitors' taps got faster. To check that:
- Compare field INP at the 75th percentile, before and after the release, over periods of the same length. Allow a few weeks so enough page loads accumulate; the 28-day window that Chrome's public field data uses is a sensible minimum.
- Split by device. Main-thread fixes help phones most. If desktop INP was already 90 ms, the overall number can hide a large mobile gain.
- Split by page. A fix on the product template should move product pages, not the blog.
- Watch for regressions. A new tag added next quarter undoes this work quietly, which is why ongoing web performance monitoring matters more than a one-off audit.
How real user monitoring differs from lab testing, and why the two disagree, is covered in its own guide. If images rather than scripts dominate your load, see how to optimize images for the web; for a broader diagnosis, see why websites load slowly.
How to verify the fix in TapCub
Take the product page from the example. The lab trace says blocking time fell from 990 ms to 190 ms. The question TapCub answers is whether visitors' interactions got faster.
- Read the baseline before you ship. Open Monitoring › Performance. Five cards show largest contentful paint, cumulative layout shift, interaction to next paint, first contentful paint and time to first byte, each against the good and poor thresholds. Switch the cards to P75, then break the trend down by page and by device to get the product page's mobile INP. Checking Core Web Vitals in TapCub walks through the screen.
- Mark the release. Add an entry in Configuration › Annotations on the day the tag cleanup and hydration split go live. It shows on the overview trend, so anyone reading traffic later knows what changed that day.
- Compare two date ranges. The performance page has no previous-period comparison, so pick the weeks before the release, note P75 INP for the product page on mobile, then pick the same number of weeks after it. Percentiles jump on pages with few samples, so wait until both ranges have a solid number of loads.
- Know what it does not tell you. TapCub reports the metric values, not which script caused a long task; attribution stays in DevTools. Vitals come from the analytics script on real loads, so if the script is blocked or an old snippet is installed, the page stays empty. In a single-page app the values describe the initial page load, not each route change.
For a one-off lab and field check of any URL, the free page speed test shows Lighthouse results next to Chrome's field data.
FAQ
What does "minimize main-thread work" mean in Lighthouse?
It is a Lighthouse diagnostic that flags pages keeping the browser's main thread busy for more than 4 seconds during load. It breaks the time into script evaluation, parsing and compilation, style and layout, rendering, HTML and CSS parsing, and garbage collection. The audit identifies the category, not the script, so use a DevTools trace grouped by origin to find which code owns the time.
What is a long task?
A long task is any piece of main-thread work that runs longer than 50 milliseconds. During that time the page cannot respond to input, so a tap that lands mid-task waits until it finishes. The part above 50 ms is the blocking period; summing blocking periods across all long tasks shows how much of the delay users can actually feel.
Do third-party scripts count as main-thread work?
Yes. Tag managers, pixels, chat and review widgets, and testing tools run their JavaScript on the same main thread as your own code, and their time shows up under script evaluation. In the sample above they owned 72.7% of blocking time. Remove the ones you no longer need, load the rest with async or defer, and lazy-load embeds near the viewport.
Will minifying JavaScript fix main-thread work?
Only slightly. Minification trims parse time a little, and gzip or Brotli compression reduces download size but not the time the browser spends parsing and running code. In the worked example, minifying first-party code saved 52.5 ms of 990 ms of blocking time, while removing, deferring and splitting long tasks saved 800 ms. Attribute the long tasks first, then decide.
Do web workers reduce main-thread work?
They do for work that does not need the DOM. Heavy parsing, sorting, filtering or image processing can move to a web worker, which runs on a separate thread and posts results back. Workers cannot update the page directly, so the final DOM change still happens on the main thread. Use them for computation, and use task splitting for UI code.
Sources
- Minimize main thread work, Chrome for Developers (Lighthouse documentation)
- Optimize long tasks, web.dev
- Interaction to Next Paint (INP), web.dev
- Efficiently load third-party JavaScript, web.dev
- Long Animation Frames API, Chrome for Developers
Was this article helpful?
We use your answers to fix and expand this page.
Couldn’t send. Please try again in a minute.
Thanks for the feedback. We’ll use it to improve this page.You’ve already sent feedback on this page. Thanks.

Technical Engineer
Focuses on tracking code, SDKs, and API integrations, with practical guidance on implementation checks and troubleshooting.