Try it on your own data
Every report in this article is in the free plan. One snippet for web and apps, up to 10 sites.
Start freeSlow loading websites are slow in one of three places: the server (time to first byte), resource downloads (largest contentful paint) or the browser's main thread (interaction to next paint). Find which one, and for whom: split real-user data by country and device, and you often find that only one group of visitors is slow.
What you will learn
- Separate the three places time goes: server (TTFB), resources (LCP), main thread (INP)
- Split real-user data by country and device; one segment often drives most slow loads
- Fix in order: server and caching, then the LCP element, then scripts
Why is my website so slow? Three places the time goes
Every page load spends time in three places, and each has its own causes and its own metric:
- The server. From the moment the visitor clicks until the first byte of HTML arrives: redirects, DNS lookup, connection and TLS setup, and the time your server or CMS takes to build the page. Measured by time to first byte (TTFB).
- The resources. Downloading the stylesheets, scripts, fonts and images the page needs before its main content can show. Visible in first contentful paint and, above all, largest contentful paint (LCP).
- The browser's main thread. Parsing, running JavaScript, calculating layout and painting. When this is busy, the page looks loaded but reacts late to taps and clicks. Measured by interaction to next paint (INP).
"The site is slow" can mean any of the three, and the fixes do not overlap. A faster server does nothing for a 2 MB hero image, and compressing images does nothing for a server that takes two seconds to respond. Common lists of "10 reasons your website is slow" mix all three together. The quicker route is to find which one is slow, and for whom.
Lab tests vs real-user data
There are two ways to measure speed, and they often disagree.
Lab tests such as Lighthouse load the page once, on one simulated device and network, from one location, with an empty cache. They are repeatable and show exactly what happened during that load, which makes them good for debugging.
Real-user data (field data) records actual visits: every device, network, country and cache state your visitors bring. web.dev's guidance is direct: field data is what you should use to prioritise your efforts, because it is what people experience. Lab data is for diagnosing why.
Why they differ, in practice:
- Your visitors' phones may be slower than the lab's simulated device, or faster.
- Visitors far from your server wait longer for every round trip; a lab test runs from one place.
- Returning visitors have files cached; lab tests start cold.
- INP only exists when someone interacts, so a lab test cannot measure it at all.
So a page can score well in a lab test and still be slow for a large group of real visitors. How real user monitoring works is covered separately. For a quick look at both views of one URL, a free page speed test shows Lighthouse results next to Chrome's public field data.
A diagnosis tree: server, then resources, then main thread
Work through the three places in order, because each one delays everything after it.
1. Check TTFB first. web.dev rates TTFB good at 0.8 seconds or less and poor above 1.8 seconds, at the 75th percentile.
- If TTFB is poor everywhere, the server is slow: uncached pages, slow database queries, an overloaded host, or a plugin doing work on every request.
- If TTFB is poor only in some countries, it is distance: no CDN, or a CDN that does not cache HTML.
- If TTFB is poor only on some URLs, look for redirect chains (
http→https→www→ trailing slash) and pages that skip the cache, such as those with query parameters.
2. Then check what delays the main content. LCP is good at 2.5 seconds or less. web.dev splits it into TTFB, resource load delay, resource load duration and render delay. Subtract TTFB from LCP: if most of what is left is downloading one large image, fix that image; if it is a long wait before the image is even requested, the image is lazy-loaded or discovered late; if it is render delay, render-blocking CSS or JavaScript is holding the paint.
3. Then check responsiveness. If LCP is fine but the page feels sluggish, INP is the metric to read. Good is 200 ms or less. Poor INP almost always means long JavaScript tasks, very often from third-party tags.
Stop at the first place that is clearly slow. Fixing a later stage while an earlier one is slow hides the gain behind the earlier wait.
Split by country and device before you fix anything
Site-wide averages hide the most common pattern in slow loading websites: the site is fast for most visitors and slow for one group. Split real-user data by country and device before deciding what to fix.
Sample data. One product page, 15,000 page loads over 28 days:
| Segment | Page loads | Good LCP (≤ 2.5 s) | P75 LCP | P75 TTFB |
|---|---|---|---|---|
| US, desktop | 4,200 | 88% | 1.9 s | 0.4 s |
| US, mobile | 5,100 | 76% | 2.4 s | 0.5 s |
| Germany, desktop | 1,300 | 84% | 2.1 s | 0.6 s |
| Germany, mobile | 1,600 | 72% | 2.6 s | 0.7 s |
| India, mobile | 1,800 | 31% | 5.8 s | 2.1 s |
| Brazil, mobile | 1,000 | 38% | 4.9 s | 1.7 s |
Work it through:
- Overall, 71.7% of loads have good LCP. Good loads per segment: 3,696 + 3,876 + 1,092 + 1,152 + 558 + 380 = 10,754, and 10,754 ÷ 15,000 = 71.7%. That headline suggests a moderately slow page everywhere.
- India and Brazil mobile are 18.7% of loads (2,800 of 15,000) but 43.9% of the slow ones: 1,242 + 620 = 1,862 of the 4,246 loads without good LCP.
- Their TTFB alone is 1.7–2.1 s. In India, TTFB uses 2.1 of the 5.8 seconds before a single image byte arrives, against 0.5 s for US mobile. That points to distance from the server, not to images or JavaScript.
- If those two segments matched US mobile's 76%, overall good LCP would rise from 71.7% to 79.6%, without touching anything US visitors already get.
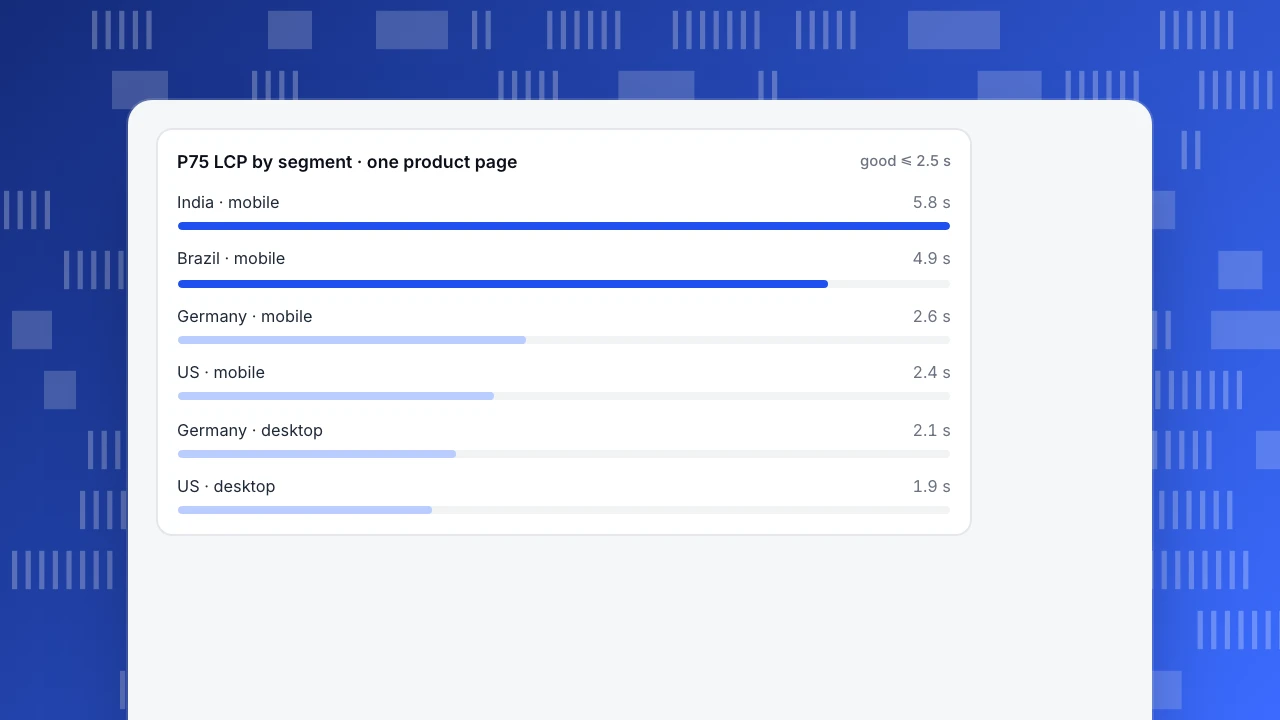
So the fix for this page is HTML caching at a CDN edge close to those visitors, not another round of image compression. Note that you cannot average segment P75s into a site P75; percentiles do not add up that way. Shares of good loads do, which is why the calculation above uses them. The chart after this section shows the segment gap.
P75 LCP by segment · one product page
good ≤ 2.5 sCommon causes and how to tell them apart
Each cause leaves a signature in the metrics. Match the symptom before applying the fix:
- Slow or overloaded hosting: poor TTFB in every country, often worse at peak hours. Fix with page caching, a bigger plan or a faster host.
- No CDN, or HTML not cached at the edge: TTFB grows with distance from the server. Fix by caching pages at the edge.
- Redirect chains: TTFB poor on some entry URLs only. Link to the final URL and collapse the chain into one hop; see redirect chains.
- Oversized or late images: LCP poor with good TTFB, and a large download on the LCP element. See how to optimize images for the web.
- Render-blocking CSS and JavaScript: long gap before first paint, even with a fast server. Inline critical CSS, defer scripts.
- Too many third-party scripts: decent LCP but poor INP, worst on phones. See how to minimize main thread work.
- Web fonts and late-inserted elements: content jumps, which shows up as poor CLS. Reserve space and preload key fonts.
- Slow devices: everything is worse on mobile than desktop at the same TTFB. Ship less JavaScript.
The comparison table after this section puts these side by side with the metric to check.
| Symptom | Metric to check | Likely cause | Fix |
|---|---|---|---|
| Slow everywhere, worse at peak hours | TTFB, all countries | Uncached pages, overloaded host | Page caching, bigger plan or faster host |
| Slow far from the server | TTFB by country | No CDN, HTML not cached at the edge | Cache HTML at a CDN edge |
| Slow on some entry URLs | TTFB by page | Redirect chain | Link to the final URL, one hop |
| Main content appears late, server fast | LCP minus TTFB | Large or lazy-loaded LCP image | Right size, no lazy loading, high priority |
| Blank screen before first paint | FCP | Render-blocking CSS / JS | Inline critical CSS, defer scripts |
| Loads fine, reacts late | INP (field only) | Long JavaScript tasks, third-party tags | Remove, defer, split long tasks |
| Content jumps | CLS | Fonts, images without size, injected banners | Reserve space, preload key fonts |
Read real-user data at the 75th percentile and split by device: the same symptom on mobile only usually means page weight or scripts, not the server.
Fix in this order
Use these rules to decide what to do first:
- If TTFB is poor for most visitors, fix the server and caching before anything else. Every other metric includes TTFB.
- If TTFB is poor only for distant visitors, put a CDN in front of the site and make sure it caches HTML, not just static files.
- If TTFB is fine but LCP is poor, find the LCP element and fix it: right size, no lazy loading, high fetch priority.
- If LCP is fine but INP is poor, attribute long tasks to scripts and remove or defer third-party code.
- If only one template is slow, fix that template; a site-wide change may not move the pages that matter.
- After each change, wait until enough real-user loads accumulate and compare the same segment before and after.
How fast is fast enough, with benchmarks by metric, is covered in what is a good page load time. Google states that it highly recommends good Core Web Vitals for success with Search, so this work also protects organic traffic, though speed alone does not rank a page.
How to find out who is slow in TapCub
The example above, a page that is fast in the US and slow on mobile in India and Brazil, is the kind of finding TapCub's performance report is built for.
- Start from P75 and the share of good loads. Open Monitoring › Performance. Five cards show largest contentful paint, cumulative layout shift, interaction to next paint, first contentful paint and time to first byte against good and poor thresholds. The cards switch among P95, P75, median and average; start with P75.
- Break it down. The trend and breakdown can be split by page, country, device, browser and operating system, at P50, P75, P90 or P99. Split LCP by country, then by device, and look for the segment that is far off the rest, like India mobile in the example.
- Read where the time goes. Load timing splits each load into backend (time to first byte), network transfer and frontend render. A slow backend share in distant countries points to the server and CDN; a slow frontend share points to scripts and rendering.
- Find the worst pages. The Slowest pages list is sorted by P75 LCP, so a single slow template stands out.
- Compare before and after. The page has no previous-period comparison, so record the segment's numbers before the change and read the same date-range length after it. Percentiles on segments with few loads jump around; wait for enough samples.
Values come from the analytics script on real visits, not from a lab run. If the script is blocked, or an old snippet does not collect vitals, the page stays empty, and server timing is not substituted. Checking Core Web Vitals in TapCub explains the screen step by step.
FAQ
Why is my website so slow on mobile but fine on desktop?
Phones have slower processors and often slower, higher-latency networks. The same JavaScript takes several times longer to run, and large images take longer to download. Compare mobile and desktop at the same TTFB: if TTFB matches but LCP or INP is much worse on mobile, the problem is page weight or scripts, not the server. Serve smaller images and ship less JavaScript.
How do I check why my website is slow?
Start with real-user data split by country and device to find who is slow, then run a lab test on the slow page to see why. Check TTFB first, then what delays the largest content, then responsiveness. A free page speed test shows lab results and Chrome field data side by side, and a browser's DevTools Performance panel shows each request and task.
Is my hosting making my website slow?
Possibly, if TTFB is poor for visitors everywhere. web.dev rates TTFB good at 0.8 seconds or less. If TTFB is high only in distant countries, the issue is distance, and a CDN that caches HTML helps more than a new host. If TTFB is good but pages still load slowly, hosting is not the problem; look at images and scripts.
Does a slow website affect SEO?
It can. Google says it highly recommends achieving good Core Web Vitals for success with Search, and those include LCP and INP. A slow page also loses visitors before they read anything. But speed is one signal among many: a fast page that does not answer the query will not rank because of speed, and fixing speed does not replace relevant content.
Why is my website slow only for some visitors?
Usually because of where they are or what device they use. Distant visitors wait longer for every round trip to your server, and mid-range phones run JavaScript slowly. In the sample above, India and Brazil mobile were 18.7% of loads but 43.9% of slow ones, mainly because of a 1.7–2.1 second TTFB. Split real-user data by country and device to find the group.
See also: Cache-Control header: what to set for each file type.
Sources
- Time to First Byte (TTFB), web.dev
- Why lab and field data can be different, web.dev
- Optimize Largest Contentful Paint, web.dev
- Web Vitals, web.dev
- Understanding Core Web Vitals and Google search results, Google Search Central
Was this article helpful?
We use your answers to fix and expand this page.
Couldn’t send. Please try again in a minute.
Thanks for the feedback. We’ll use it to improve this page.You’ve already sent feedback on this page. Thanks.

Technical Engineer
Focuses on tracking code, SDKs, and API integrations, with practical guidance on implementation checks and troubleshooting.