Try it on your own data
Every report in this article is in the free plan. One snippet for web and apps, up to 10 sites.
Start freeA small business dashboard needs five to seven numbers, not forty. Each one should answer a single question: do we need to do something this week? A number that cannot trigger an action belongs in the monthly report instead. Below: how to pick the numbers from how money moves through your business, examples for three business types, a threshold and action for each, and a worked week.
What you will learn
- Pick one number per stage: demand, conversion, value, quality, cash, plus your weak spot
- Write a threshold and an action next to every number; no action means monthly report
- Choose numbers that multiply into revenue, so a drop explains itself
What is a small business dashboard?
A small business dashboard is one page with the five to seven numbers an owner checks every week to decide whether to act. It is not a wall of charts. Larger companies have analysts to read a 40-tile dashboard and turn it into decisions; a small business has the owner, on a Monday morning, with fifteen minutes.
That constraint is the design brief. Every number on the page should answer the same question: do we need to do something this week? If a number can move 20% and nobody would change anything, it does not belong on the weekly page. It belongs in a monthly report, where you look for trends rather than triggers.
This is narrower than the general advice in KPI dashboard, which covers layouts and metric selection for teams of any size, and in analytics dashboard, which is about website and product data specifically. If marketing is a separate function in your business, its own page is covered in marketing dashboard. This article is for owners and small teams without a data person: what to put on one weekly page, what threshold makes each number actionable, and what to move off it.
How do you choose the five to seven numbers?
Start from how money moves through the business, not from what your tools report by default. Most small businesses have the same five stages:
- Demand — are enough people finding you? Visitors, enquiries, foot traffic, trial signups.
- Conversion — are they buying? Conversion rate, quote acceptance rate, trial-to-paid rate.
- Value — how much is each sale worth? Average order value, average job size, average revenue per account.
- Delivery and quality — are you delivering what you sold? Refund rate, on-time rate, support response time.
- Cash — can you keep going? Cash on hand, weeks of runway, overdue invoices.
Pick one number per stage, then add one or two for whatever is your known weak spot (repeat customers for a store, no-shows for a clinic). That gives five to seven.
Then apply three rules to each candidate:
- It must have an action. Write "if this crosses X, we do Y" next to it. If you cannot, it goes to the monthly report.
- Prefer a rate next to its count. Conversion rate alone hides a traffic collapse; orders alone hide whether you are converting better. Show both, or show the rate with the count in small type.
- Include cash. The U.S. Small Business Administration's guidance on managing finances centres on tracking cash flow alongside the balance sheet. Revenue can look healthy while cash runs out because customers pay late or stock ties it up.
The test for borderline numbers is the one used to separate KPIs from metrics in metrics vs KPIs: a goal, an owner and a threshold that triggers action. On a small team the owner is usually you, which makes the threshold rule more important, not less.
Small business dashboard examples by business type
The table below shows three business dashboard examples built with the five-stage rule. Each column is a complete weekly page. The rows line up by stage, so you can see how the same question takes a different number in a different business.
A few notes on adapting them:
- E-commerce stores usually have good data on demand, conversion and value from their analytics and store platform. The weak spot is often refunds and returns, which sit in a different system. Pull the refund count in weekly, even by hand.
- Local service businesses (trades, clinics, salons, agencies) often get demand through phone calls and messages rather than web forms. Count enquiries from every channel, not just the website, or the demand number will understate reality. The weak spot is usually capacity: booked hours versus available hours.
- Small SaaS companies have the opposite problem: lots of product data and a temptation to track all of it. Keep activation and trial-to-paid on the weekly page and move feature usage to the monthly report.
Whatever the business, if you find yourself adding an eighth number, remove one. The limit is what makes the page readable in fifteen minutes.
| Stage | E-commerce store | Local service business | Small SaaS |
|---|---|---|---|
| Demand | Visitors | Enquiries (all channels) | Trial signups |
| Conversion | Conversion rate | Quote acceptance rate | Trial-to-paid rate |
| Value | Average order value | Average job value | Revenue per new account |
| Result | Weekly revenue | Weekly booked revenue | New monthly recurring revenue |
| Quality | Refund rate | Callback or redo rate | First response time |
| Cash | Weeks of cash runway | Overdue invoices | Months of runway |
| Weak spot (optional) | Repeat purchase rate | Booked vs available hours | Activation rate |
Each column is a complete weekly page; the worked example uses the first six e-commerce rows.
What threshold and action goes with each number?
A number without a threshold is decoration. For each one, write the normal range, the threshold that means "look at this now", the action and the owner. Here is the e-commerce column filled in, using a four-week average as "normal":
| Number | Normal (4-week avg) | Threshold | Action | Owner |
|---|---|---|---|---|
| Visitors | 6,000 a week | Below 5,000 | Check traffic by source; did a campaign stop or a ranking drop? | Owner |
| Conversion rate | 2.5% | Below 2.2% | Test the checkout on mobile; check for errors and stock-outs | Owner |
| Average order value | $57 | Below $50 | Review discount codes and bundle offers running this week | Owner |
| Revenue | $8,550 a week | Below $7,000 | Follows from the three above; read them first | Owner |
| Refund rate | 3% of orders | Above 5% | Read the refund reasons; check the product or supplier | Operations |
| Cash runway | 9 weeks of fixed costs | Below 8 weeks | Delay the next stock order; chase overdue payments | Owner |
Three tips on setting thresholds. Set them from your own history, not industry benchmarks: four to eight weeks of data is enough to see your normal range. Set them far enough from normal that they fire a few times a quarter, not every week; if a threshold fires constantly, it gets ignored. And for counts with strong weekly seasonality, such as weekend-heavy stores, compare against the same weeks rather than a flat average. NIST's statistics handbook gives the more formal version, control limits a fixed number of standard deviations from the mean, if you want to calculate the band instead of eyeballing it.
Worked example: reading one week's numbers
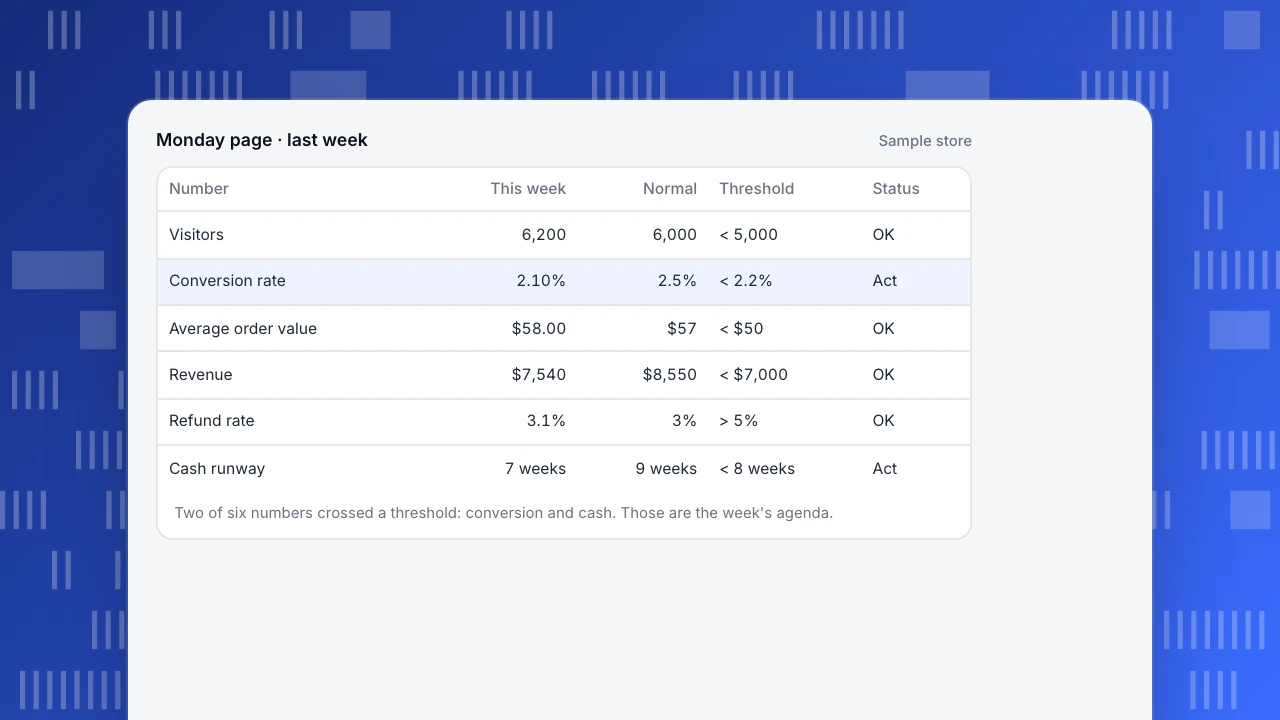
Sample data. The e-commerce store's Monday page for last week:
- Visitors: 6,200, up 3.3% on the 6,000 average. Above threshold. No action.
- Conversion rate: 130 orders ÷ 6,200 visitors = 2.10%, against a 2.5% normal and a 2.2% threshold. Crossed.
- Average order value: $7,540 revenue ÷ 130 orders = $58.00, against $57 normal. No action.
- Revenue: $7,540, down 11.8% on the $8,550 average (6,000 visitors × 2.5% × $57). Above the $7,000 threshold, but the cause is visible in the line above.
- Refund rate: 4 refunds ÷ 130 orders = 3.1%. Below the 5% threshold. No action.
- Cash runway: $42,000 cash ÷ $6,000 weekly fixed costs = 7 weeks, below the 8-week threshold. Crossed.
Revenue fell because conversion fell; traffic and order value were fine. That is the whole diagnosis, and it took one minute because the numbers were chosen to decompose revenue: visitors × conversion × order value.
So the week has two items, not six: test the checkout on mobile and check for stock-outs (conversion), and push the next stock order back two weeks while chasing two overdue wholesale invoices (cash). The other four numbers get no meeting. That is the point of the thesis: five to seven numbers, each answering "do we act this week?", and most weeks most of them answer no.
Monday page · last week
Sample store| Number | This week | Normal | Threshold | Status |
|---|---|---|---|---|
| Visitors | 6,200 | 6,000 | < 5,000 | OK |
| Conversion rate | 2.10% | 2.5% | < 2.2% | Act |
| Average order value | $58.00 | $57 | < $50 | OK |
| Revenue | $7,540 | $8,550 | < $7,000 | OK |
| Refund rate | 3.1% | 3% | > 5% | OK |
| Cash runway | 7 weeks | 9 weeks | < 8 weeks | Act |
Two of six numbers crossed a threshold: conversion and cash. Those are the week's agenda.
Where do the other metrics go?
Moving a metric off the weekly page does not mean ignoring it. It means looking at it on a different rhythm, for trends rather than triggers. A monthly report is the right place for:
- Traffic detail — top pages, sources, countries, devices, bounce rate, pages per session.
- Channel economics — spend and return by channel, cost per order.
- Customer patterns — repeat purchase rate, customer lifetime value, best-selling products.
- Operational detail — supplier lead times, support volume by topic.
- Experiments and changes — what you changed this month and what happened afterwards.
The monthly review asks a different question: is anything drifting that we should plan for? A slow rise in mobile share, a channel whose cost per order creeps up for three months, a product category that is fading. These matter, but none of them needs a reaction this Tuesday. Writing that review up so others can follow it is covered in data analysis report.
Common small business dashboard mistakes
- Too many numbers. Twenty tiles means nothing stands out. Nielsen Norman Group's guidance on dashboards explains preattentive processing: a bar that differs in length or colour "pops out" without a visual search. A page where every tile differs gives the eye nothing to pop out from.
- No thresholds. Without a written threshold, every dip starts a discussion and every rise is ignored.
- Vanity numbers on the weekly page. Social followers and total pageviews rarely trigger an action. Move them to the monthly report.
- Revenue only. Revenue tells you something changed but not what. Show the parts it is made of.
- No cash line. Profitable on paper and short of cash is a common way for small businesses to get into trouble.
- Pulling instead of pushing. A dashboard you have to remember to open gets opened less often. Have the weekly numbers sent to you.
- Bots in your traffic numbers. If crawlers count as visitors, your conversion rate is understated and moves with bot activity, not customers.
How to run a small business dashboard in TapCub
Here is how the e-commerce page from the example would come together in TapCub. TapCub covers the demand, conversion and value numbers; cash and refunds from your bank or accounting software stay in your own spreadsheet.
- Demand and conversion. Web analytics › Overview shows visitors, sessions and trends, with recognised bots counted separately rather than added to visitors. In Web analytics › Goals, set the order confirmation as a goal; the cards show conversions, converting visitors and the rate, which divides by unique visitors in the selected dates. Turn on Track revenue with a revenue property and the goal also sums revenue.
- Orders and order value. If you send a purchase event from your server with order id, amount and currency, All-platform analytics › Business › Commerce & revenue shows revenue, orders, buyers, average order (revenue ÷ orders), repeat rate and refunds, converted into the site's base currency.
- Get the weekly numbers sent to you. Under Configuration › Settings › Notifications, turn on the weekly scheduled report. It goes out on Monday for the previous Monday to Sunday, with visitors, pageviews, sessions, bounce rate and average duration with period change, rising pages and sources, conversions for enabled goals and a short reading, through channels such as WeCom, DingTalk, Feishu or a webhook.
- Alert only on what cannot wait a week. In All-platform analytics › Operations › Monitors, add a collection-gap monitor (no data for a set number of minutes, often a broken tag or a site outage) and a visitor-drop monitor. Use the dry run to see how often each would have fired in the last 30 days. Monitors only notify; they do not fix anything.
- Share without handing over the login. Configuration › Settings › Public sharing creates a read-only link for a partner or accountant, optionally with a password, limited to chosen modules and a number of days. Visitor lists and sessions cannot be shared publicly. Steps are in share a dashboard.
FAQ
What should be on a small business dashboard?
One number for each stage of how money moves through the business: demand (visitors or enquiries), conversion (rate of buyers), value (average order or job size), delivery quality (refund or on-time rate) and cash (runway or overdue invoices). Add one or two for your known weak spot, stay within five to seven, and write a threshold and an action next to each number.
How many KPIs should a small business track?
Five to seven on the weekly page is enough for most small businesses. That is few enough to read in fifteen minutes and broad enough to cover demand, conversion, value, quality and cash. Track more in a monthly report if you like, but only numbers that can trigger an action this week belong on the weekly dashboard.
How often should a small business review its dashboard?
Weekly for the five to seven action numbers, monthly for trends, and immediately only for alerts that cannot wait, such as tracking stopping or traffic collapsing. Daily checking of weekly numbers mostly shows noise and invites overreaction. Set thresholds from four to eight weeks of your own history so a breach means something.
What is the difference between a dashboard and a report?
A dashboard shows the current state of a few numbers and is checked on a fixed rhythm to decide whether to act. A report explains a change or a trend, makes an argument and recommends something. For a small business, the weekly dashboard flags what moved, and the monthly report or a one-off analysis explains why.
Can a small business dashboard be built in a spreadsheet?
Yes. A spreadsheet with one row per week and one column per number, plus a column for the threshold, works well and costs nothing. The weak points are manual data entry and remembering to look. Pulling traffic and conversion numbers from analytics automatically and having them sent weekly removes most of that work; cash usually stays in the spreadsheet.
Sources
- U.S. Small Business Administration. Manage your finances.
- Nielsen Norman Group. Dashboards: Making Charts and Graphs Easier to Understand.
- NIST/SEMATECH. e-Handbook of Statistical Methods, 6.3.1: What are control charts?
Was this article helpful?
We use your answers to fix and expand this page.
Couldn’t send. Please try again in a minute.
Thanks for the feedback. We’ll use it to improve this page.You’ve already sent feedback on this page. Thanks.

Product Experience Specialist
Writes about product experience, practical workflows, and growth, turning complex processes into clear steps for everyday decisions.