Try it on your own data
Every report in this article is in the free plan. One snippet for web and apps, up to 10 sites.
Start freeThe types of bias in data analysis are easiest to handle when grouped by where they enter: sampling (who is in the data), measurement (how values were recorded), analysis (how data was processed) and interpretation (how results were read). Each stage has one signal you can check in your own report first. Below: a table of all four, one paragraph per common bias, a worked bot-traffic example and a checklist.
What you will learn
- Group biases by the step where they enter: sampling, measurement, analysis, interpretation
- Each step has a first signal to check: sample mix, step changes and bot share, results by segment, a hypothesis written in advance
- A bigger sample does not remove bias; fixing who is counted and how values are recorded does
What are the main types of bias in data analysis?
Lists of biases run long. The Catalogue of Bias maintained at Oxford has dozens of entries, and David Sackett's 1979 paper that started it listed 35 biases in sampling and measurement plus 56 that can affect case-control and cohort studies. A list that long is hard to use when a report looks wrong on a Tuesday afternoon. What makes it usable is the idea Sackett built in from the start: biases enter at a particular stage of the work.
For business and product data, four stages cover nearly everything:
- Sampling — who or what ended up in your data. The people you measured differ from the people you want to describe.
- Measurement — how the numbers were recorded. The tracking, the survey question or the person collecting the data shifts the values in one direction.
- Analysis — how the numbers were processed. A comparison mixes groups, leaves out a variable or keeps testing until something looks significant.
- Interpretation — what you conclude. The data is fine, but the reading of it leans toward what you already expected or what happened last.
All four are statistical bias in the strict sense: a systematic gap between what you estimate and what is true, as opposed to random error that shrinks as you collect more data. NIST's 2022 report on bias in AI groups bias into systemic, statistical/computational and human categories. The four stages here are a practical cut of the last two, ordered the way an analysis actually runs, so you can walk a report from the top and know where to look.
The table below gives each stage its typical biases, an example from web and product data, and the one signal to check first. The rest of this article takes the stages one at a time, with one paragraph per bias and a link to the full glossary entry where we have one.
| Stage | Typical biases | Example in web data | Check first |
|---|---|---|---|
| Sampling | Sampling, selection, survivorship, non-response | Survey sent only to newsletter subscribers | Sample mix vs population (device, channel, plan) |
| Measurement | Non-human traffic, instrumentation, observer, Hawthorne, recall | Crawlers counted as visitors | Step changes on release dates; bot share |
| Analysis | Confounding, Simpson's paradox, p-hacking, outliers, regression to the mean | Overall result flips inside device segments | Does the result hold within the two biggest segments? |
| Interpretation | Confirmation, recency, base-rate neglect, causal over-reach | One bad week triggers a strategy change | Was the hypothesis written down before the data? |
Stages follow the order an analysis runs; a bias can be fixed most cheaply at the stage where it enters.
Sampling biases: who ended up in your data?
Sampling biases happen before a single number is calculated. The data can be recorded perfectly and still describe the wrong group.
Sampling bias. Some members of the population were more likely to be included than others, so the sample's mix differs from the population's. A customer survey sent only to newsletter subscribers over-represents your most engaged customers. The fix is to sample in a way that gives every group a known chance of inclusion, or to weight results back to the population. Details and a worked example are in sampling bias; when groups differ a lot, stratified sampling is the usual remedy. "Sample bias" is the same idea under a shorter name.
Selection bias. The groups you compare were formed in a way that is linked to the outcome. Visitors who choose to open a chat, join a beta or install your app are different from those who do not, before your product does anything to them. Comparing the two and calling the difference an effect is the classic selection error. See selection bias.
Survivorship bias. You only see the cases that made it through a filter. Analysing your current customers to learn why people stay ignores everyone who already left, and the reasons they left. Churned accounts, deleted apps and failed campaigns rarely appear in the dataset you are looking at. See survivorship bias.
Non-response bias. People who answer a survey differ from people who ignore it. If 8% respond to a satisfaction survey, the result describes that 8%, and very happy and very unhappy customers tend to be over-represented. The Catalogue of Bias entry on non-response bias covers the mechanics.
Signal to check first: compare the composition of your sample with the population on two or three things you know for both, such as device mix, new versus returning visitors, or plan type. If the sample is 70% desktop and your traffic is 45% desktop, every number from that sample needs a caveat.
Measurement biases: how were the numbers recorded?
Measurement biases change the values themselves. They are the most common source of "the numbers look wrong" in web analytics, because tracking sits between reality and the report.
Non-human traffic. Crawlers, monitoring tools, scrapers and AI agents load pages. If they are counted as visitors, they inflate the denominator of every rate and almost never convert. The IAB/ABC International Spiders & Bots List exists because ad and audience measurement needs a shared way to filter them out. The worked example below shows how much this moves a conversion rate.
Instrumentation bias. A tag fires twice, a consent banner suppresses events for some regions, a new release renames an event. The data now systematically over- or under-counts for part of the period or part of the audience. It usually shows up as a step change on the day of a deploy rather than a gradual trend.
Observer and experimenter bias. The person running the study influences the result, through how they assign users, label sessions or read ambiguous cases. An analyst who expects a redesign to win codes borderline session recordings as "satisfied". See experimenter bias; the Catalogue of Bias also has a separate entry on observer bias.
Hawthorne effect. People change behaviour because they know they are being observed. Usability test participants try harder than real users; a sales team that knows a dashboard is new and watched logs more activity for a few weeks.
Recall bias. Self-reported data drifts from what happened. Asked "how did you hear about us?", buyers name the last or most memorable touchpoint, not necessarily the first.
Signal to check first: look for step changes that line up with releases, consent changes or tracking edits, and check what share of recorded traffic is non-human. A metric that moves on a single day and stays there is more often a measurement change than a behaviour change.
Worked example: how much do bots pull down a conversion rate?
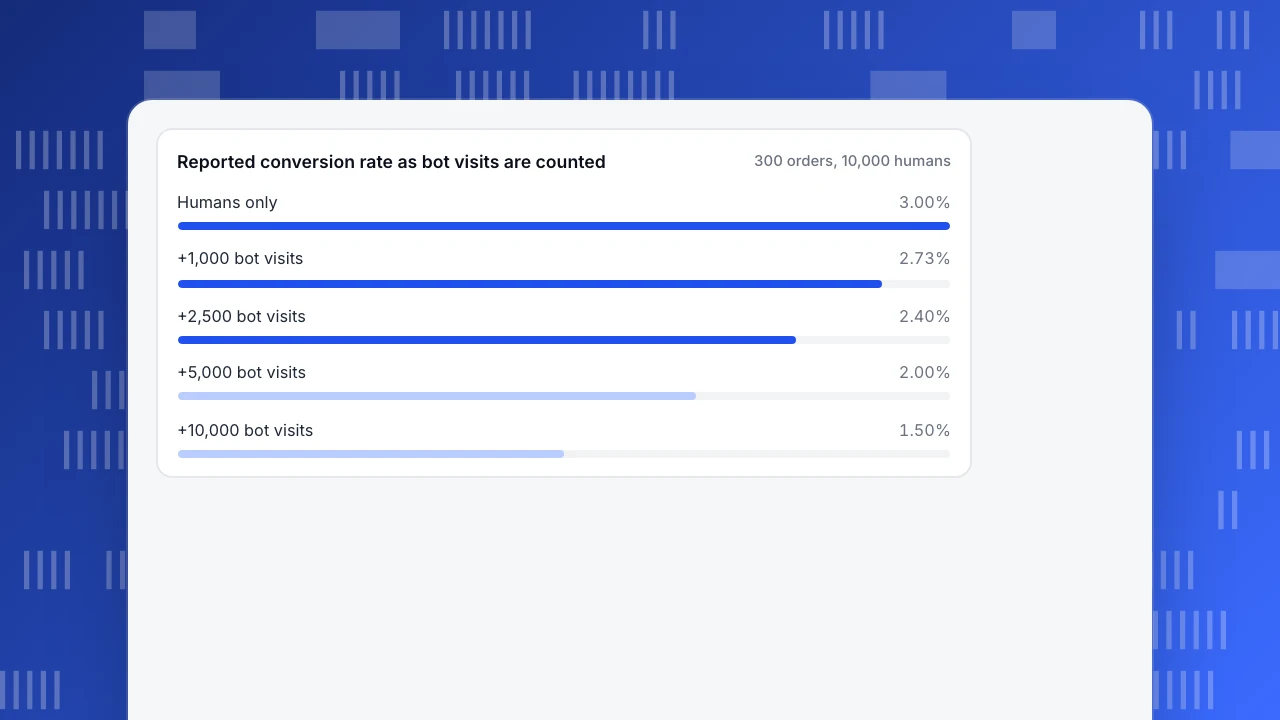
Sample data. A store has 10,000 human visitors in a month and 300 orders. Its true visitor conversion rate is 300 ÷ 10,000 = 3.00%.
Now suppose its analytics counts crawler and monitoring visits as visitors. Bots almost never place orders, so the numerator stays at 300 while the denominator grows:
| Bot visits counted as visitors | Denominator | Reported conversion rate | Share of true rate |
|---|---|---|---|
| 0 | 10,000 | 300 ÷ 10,000 = 3.00% | 100% |
| 1,000 | 11,000 | 300 ÷ 11,000 = 2.73% | 91% |
| 2,500 | 12,500 | 300 ÷ 12,500 = 2.40% | 80% |
| 5,000 | 15,000 | 300 ÷ 15,000 = 2.00% | 67% |
| 10,000 | 20,000 | 300 ÷ 20,000 = 1.50% | 50% |
At 2,500 bot visits, a fifth of the "visitors" are not people, and the reported rate understates the real one by 0.6 percentage points, or 20%. Nothing about the customers changed.
The more dangerous version is a bot spike in the middle of a comparison. If bot visits jump from 1,000 one month to 4,000 the next while humans and orders stay flat, the reported rate falls from 300 ÷ 11,000 = 2.73% to 300 ÷ 14,000 = 2.14%. That looks like a 22% drop in conversion, and someone will start redesigning the checkout.
Two lessons follow. A bigger sample does not help: double the traffic with the same bot share and the rate is just as wrong. And the fix belongs at the measurement step, by removing non-human traffic from the denominator, not at the analysis step with clever statistics.
Reported conversion rate as bot visits are counted
300 orders, 10,000 humansAnalysis biases: how were the numbers processed?
Analysis biases appear when correct data is summarised or compared in a way that distorts it.
Confounding. A third variable drives both the thing you changed and the outcome. Customers who use a feature also retain better, but both may be caused by company size. Until you account for it, the feature gets credit for the size effect. See confounding variable.
Simpson's paradox. A trend that holds in every segment reverses when the segments are combined, because the mix of segments differs between the groups being compared. A new landing page can convert better on both mobile and desktop and still look worse overall if it received far more mobile traffic. See Simpson's paradox.
P-hacking and multiple comparisons. Slice a test by enough segments, metrics and date ranges and something will cross p < 0.05 by chance. With 20 independent comparisons at that threshold, you expect about one false positive even when nothing is going on. See p-hacking and false discovery rate.
Outlier handling. Dropping or keeping a few extreme values can swing an average. Removing every order above a cut-off because it "looks like a test" can delete your real wholesale buyers. Decide the rule before you see the result; options are covered in outliers in data.
Regression to the mean. Pick the worst-performing week, page or campaign, intervene, and it improves next period, partly because extreme values tend to move back towards average on their own. See regression to the mean.
Signal to check first: break the headline result down by one or two major segments (device, channel, new versus returning). If the effect disappears or flips inside the segments, the headline is an artefact of the mix.
Interpretation biases: what did you conclude?
Interpretation biases live in the reader. The numbers and the method can be sound while the story drawn from them is not.
Confirmation bias. You notice and accept results that support what you already believe and scrutinise the ones that do not. A team convinced that chat drives sales will dig into every week where it did not, and wave through every week where it did. The Catalogue of Bias entry on confirmation bias describes how it shapes both search and interpretation.
Recency bias. The last data point carries more weight than it deserves. One bad week after six good ones triggers a strategy review. See recency bias.
Base-rate neglect. You judge a result without its denominator. "Half of our churned users never set up an integration" means little if half of all users never set one up. See base rate fallacy.
Causal over-reach. A correlation in observational data is read as cause and effect. Visitors who chat convert more often, but they also arrived with more intent. The distinction and how to test it are in correlation vs causation.
Signal to check first: ask whether the hypothesis and the success metric were written down before anyone looked at the data. If they were not, treat the conclusion as a lead to test, not a finding.
A bias checklist you can run on any report
Bias in data analysis comes in at one of four steps, and each step has a signal you can check before you trust the number. Run these in order; stop and fix at the first one that fails.
- Population. Who should this number describe? If the sample's device, channel or plan mix differs from that population by more than about ten points, re-weight or caveat it.
- Exclusions. What was filtered out: churned users, failed orders, bots, regions without consent? If something was removed, write down what.
- Non-human share. What share of recorded traffic is crawlers or monitoring? If it is unknown, that is the first thing to find out.
- Step changes. Does the series jump on a release or tracking-change date? If yes, compare the periods before and after separately.
- Segments. Does the result hold within the two biggest segments? If it flips, report by segment, not overall.
- Number of looks. How many metrics and slices were tried before this one? If more than a handful, discount any single "significant" result.
- Sample size. How many people are behind the rate? A conversion rate of 22% from 18 people has a 95% interval of roughly 9% to 45%.
- Prior hypothesis. Was the expected result written down first? If not, label the conclusion as exploratory.
How to check for bias in TapCub
The bot example above is the one TapCub handles for you by default. The rest of the checklist still needs judgment, but some steps have a direct place in the console.
- Keep bots out of the denominator. In new projects, Web analytics › Bots is set to detect and count bots separately: recognised crawlers and AI agents appear only in that report and are not added to visitor counts, so the 300 orders in the example are divided by the 10,000 humans, not 12,500. The All bots tab lists each bot's operator, purpose, requests and pages, so a spike is visible on its own rather than as a fall in conversion.
- Mark measurement changes on the chart. Add a release annotation in Configuration › Annotations whenever tracking changes. A step change that lines up with an annotation is checklist item 4 answered at a glance.
- Test whether a change holds across segments. All-platform analytics › Operations › AI Assistant has a Why did it change tab that splits a metric's change versus the previous period by channel, referrer domain, country, device, entry page or platform, with each value's share of the total change. If one segment explains most of a drop, look at its mix before calling it a trend.
- Respect small samples and self-selection. Live chat › Reports › Conversion attribution compares visitors who chatted with those who did not, and flags fewer than 30 chatters as too small to rely on. The comparison is still observational: chatters chose to chat, which is selection bias the report cannot remove.
- Draw random groups when you need them. Rule segments in All-platform analytics › Users › Segments & tags include a random bucket condition, useful for picking a random subset of identified users. TapCub does not split traffic or run A/B tests, and anonymous visitors have no profile and do not enter segments.
FAQ
What are the four types of bias in data analysis?
Grouped by where they enter, the four types are sampling bias (who is in the data), measurement bias (how values were recorded), analysis bias (how data was processed or compared) and interpretation bias (how results were read). Each has a quick first check: sample mix against the population, step changes and bot share, results within segments, and whether the hypothesis was written down before the data was examined.
What is statistical bias?
Statistical bias is a systematic difference between an estimate and the true value. Unlike random error, it does not average out as you collect more data: a survey that reaches only engaged customers stays skewed at 100 or 10,000 responses. Types of bias in statistics include selection, survivorship, measurement, confounding and reporting biases, each with its own fix.
Can a larger sample size reduce bias?
No. A larger sample reduces random error, not bias. In the worked example, if bots are 20% of recorded visits, doubling traffic keeps them at 20% and the conversion rate stays understated by the same fifth. You remove bias by fixing who is included, how values are recorded or how groups are compared, not by collecting more of the same data.
What is the difference between sampling bias and selection bias?
Sampling bias is about how the sample was drawn: some members of the population were more likely to be included, so the sample does not represent it. Selection bias is about how comparison groups were formed: membership is linked to the outcome, as when visitors choose to chat. The terms overlap and are often used interchangeably, but the fixes differ.
How do you reduce bias in data analysis?
Work through the stages in order. Define the population and compare your sample's mix with it, remove non-human traffic and annotate tracking changes, check that results hold within major segments, limit the number of slices you test, and write the hypothesis down before looking. Most bias is cheaper to prevent at the sampling and measurement steps than to correct later.
See also: What is self-selection bias? Product examples, calculations and how to reduce it.
Sources
- Sackett, D. L. (1979). Bias in analytic research. Journal of Chronic Diseases, 32(1–2), 51–63.
- Catalogue of Bias Collaboration. Selection bias, Non-response bias, Confirmation bias. University of Oxford, Centre for Evidence-Based Medicine.
- Schwartz, R. et al. (2022). Towards a Standard for Identifying and Managing Bias in Artificial Intelligence. NIST Special Publication 1270.
- IAB and Alliance for Audited Media. IAB/ABC International Spiders & Bots List.
Was this article helpful?
We use your answers to fix and expand this page.
Couldn’t send. Please try again in a minute.
Thanks for the feedback. We’ll use it to improve this page.You’ve already sent feedback on this page. Thanks.

Data Analyst
Explores traffic sources, conversion funnels, and retention, using clear metric definitions and concrete examples to explain what the numbers mean.