Try it on your own data
Every report in this article is in the free plan. One snippet for web and apps, up to 10 sites.
Start freeA good website layout orders the page by what visitors came to do. The first screen answers three questions: what is this, what is in it for me and where do I click next. Before changing a layout, check what visitors actually see with click maps and scroll depth: a button few people reach cannot be fixed by rewording it.
What you will learn
- Order sections by the visitor's task; the layout type is the smaller decision
- The first screen must say what it is, why it matters and where to click next
- Check scroll reach and clicks before and after a change; reach often explains weak clicks
What a website layout is
A website layout is the arrangement of a page's parts: header and navigation, the main content blocks, calls to action, supporting media and the footer, and the order and space each one gets on desktop and mobile. It sits between information architecture (which pages exist) and visual design (colour, type, imagery).
Most layout guides list patterns such as F, Z, grid and split screen. The pattern is the smaller decision. The larger one is order: what a visitor sees first, second and last. A layout works when that order follows the visitor's task. Someone landing on a pricing page wants to compare plans; someone landing on a blog post wants the answer; someone landing on the homepage from an ad wants to know whether this is for them. The same grid can serve all three badly or well depending on what goes at the top.
A practical definition, then: a good layout puts what most visitors need to decide their next step where most visitors will actually see it.
Common layout types and when to use each
Templates and page builders offer dozens of variations, but most fall into a handful of types:
- Single column. One stream of content, top to bottom. It suits long-form articles, landing pages with one goal and anything read mostly on phones, where every layout collapses to one column anyway.
- Z-pattern. Logo top left, navigation or a call to action top right, a hero across the middle, a second action bottom right. It suits simple pages with little text and one main action. It is a design convention, not an eye-tracking finding (more on that below).
- F-pattern or text-heavy. A strong top line, headings and a left edge that scanners can run down. News sites, documentation and search results use this structure.
- Card or grid. Equal tiles for equal items: products, articles, templates. It suits browsing among many similar choices.
- Split screen. Two halves with equal weight. It suits a genuine either/or, such as "for buyers / for sellers", or product image next to product details.
- Magazine. Several columns of mixed-size blocks. It suits publishers with many stories of different importance.
- Sidebar. Main content plus a narrow column of navigation or filters. It suits documentation, dashboards and category pages with filters.
Choose the type from the page's job, not from a gallery. The comparison table after this section lists what each type is good for and the mistake to watch for.
| Layout type | Best for | Watch out for |
|---|---|---|
| Single column | Long reads, one-goal landing pages, mobile | Primary action buried far down a long page |
| Z-pattern | Sparse pages with one main action | It is a convention, not an eye-tracking result |
| F-pattern / text-heavy | News, documentation, search results | Unformatted text; NN/g sees the F as a symptom |
| Card / grid | Browsing many similar items | Equal tiles hide what matters most |
| Split screen | A real either/or, image beside details | Order when it collapses to one column on phones |
| Magazine | Publishers with stories of mixed weight | Clutter; unclear first click |
| Sidebar | Docs, dashboards, filterable categories | Sidebar drops to the bottom on mobile |
Choose from the page's job, then confirm with scroll reach and clicks by device.
What eye-tracking research actually says
Layout advice often cites eye-tracking as if it proved a pattern. The original research says something narrower.
The F-pattern. Nielsen Norman Group first reported it in a 2006 eye-tracking study: on text-heavy pages, people read across the top, then a shorter line lower down, then scan down the left side. NN/g's 2017 follow-up found the pattern still occurs, and stresses that it appears when text has little or no formatting for the web. In other words, it is a symptom to design against, not a template to design for. Its remedies: put the most important points in the first two paragraphs, front-load headings and subheadings with key words, and use bullets and bold for key terms.
Attention above the fold. In NN/g's scrolling and attention study, 2018 data from 120 participants on 1920×1080 screens showed that 57% of viewing time went to the first screenful and about 74% to the first two screenfuls. In the 2010 version of the study, the first screenful got 80%. People scroll more than they used to, but attention still falls steeply with depth.
The Z-pattern. We could not find an NN/g eye-tracking study that establishes it. Treat it as a reasonable composition rule for sparse pages, not as evidence about how people look.
What this means for layout: the first screen gets the most attention, attention decays as people scroll, and on text pages, structure (headings, short paragraphs, lists) decides what scanners pick up. None of it tells you what your visitors do on your page. Your own click and scroll data does.
What goes above the fold
The first screen has to answer three questions within seconds: what is this, what is in it for me, and where do I click next. A checklist:
| Element | Question it answers | Example |
|---|---|---|
| Headline | What is this? | "Website analytics and live chat in one script" |
| Subheadline | What is in it for me? | One sentence on the main benefit for this audience |
| Primary call to action | Where do I click next? | One button with a specific verb: "Start free", "See pricing" |
| Visual | Can I picture it? | Product screenshot, the actual item, a short demo |
| Proof | Can I trust it? | A short customer quote or a concrete number you can source |
| Navigation | Where else can I go? | Few, clearly named top-level links |
Rules that keep the first screen working:
- One primary action. Two equal buttons split attention; make the second visibly secondary. How to phrase it is covered under call to action.
- Specific beats clever. A headline that names the product category is understood faster than a slogan the visitor has to decode.
- Leave a hint of what is below. NN/g warns against "false floors", screens that look finished, so the next section should peek into view.
- Check the real first screen. On a 390-pixel-wide phone, the hero image alone can fill the viewport and push the headline and button below it.
Order the rest of the page by visitor task
Below the fold, sections should follow the questions visitors ask, in the order they ask them. Website layout examples by page type:
- Homepage: what it is → who it is for → main benefits → how it works → proof → pricing or next step → footer navigation.
- Landing page from an ad: the promise from the ad, repeated → the main benefit → proof → objections answered → the same call to action again.
- Product page: images and price → key specifications → add to cart → details, reviews, delivery and returns.
- Pricing page: plan comparison → what is included → frequently asked questions → contact for larger plans.
- Blog post: title and answer → body with headings → related reading → subscription.
Two rules apply to every page type. First, if a section exists only because a competitor has it, test whether anyone reaches it before you keep it. Second, repeat the primary call to action after the sections where people decide, not only at the top and bottom.
Worked example: scroll reach and button position
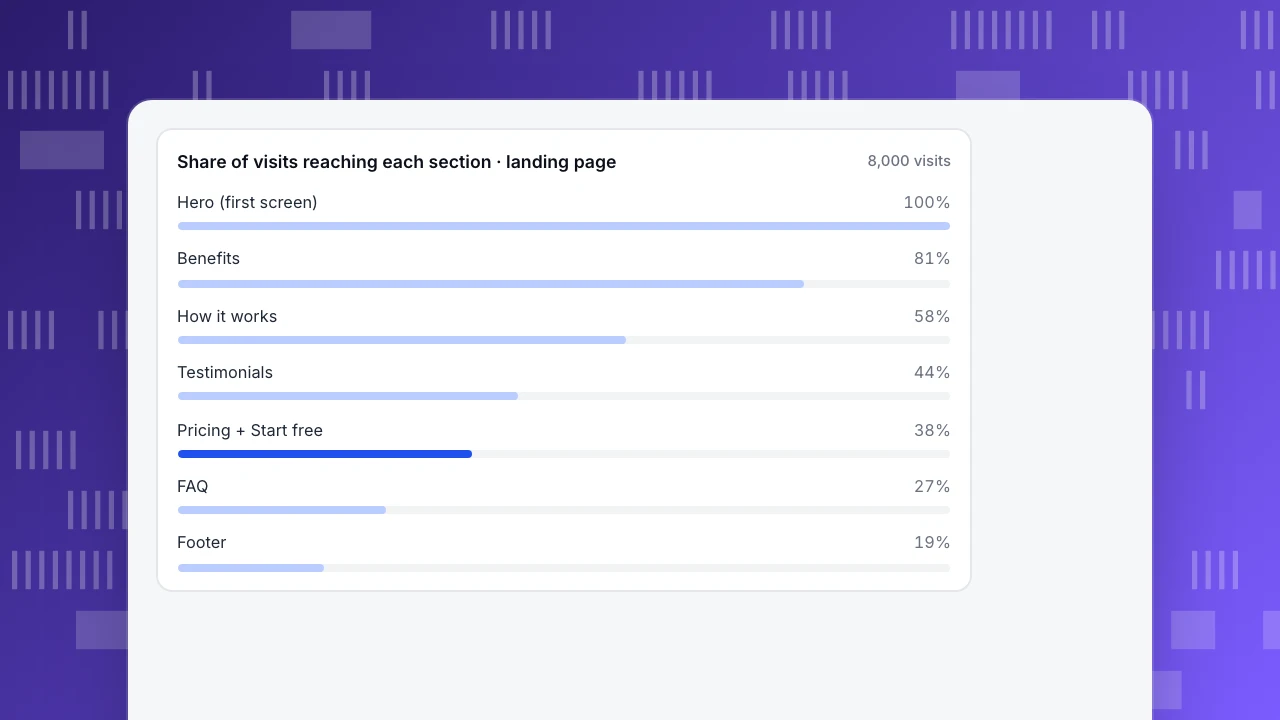
Sample data. A SaaS landing page, 8,000 visits in 30 days. Scroll depth shows the share of visits that reached each section:
| Section | Share of visits reaching it | Visits |
|---|---|---|
| Hero (first screen) | 100% | 8,000 |
| Benefits | 81% | 6,480 |
| How it works | 58% | 4,640 |
| Testimonials | 44% | 3,520 |
| Pricing + "Start free" button | 38% | 3,040 |
| FAQ | 27% | 2,160 |
| Footer | 19% | 1,520 |
The only "Start free" button sits in the pricing section. It received 182 clicks.
- Clicks per visit: 182 ÷ 8,000 = 2.3%. This is the number that looks weak in a report.
- Clicks per visit that reached the button: 182 ÷ 3,040 = 6.0%. The people who saw the button responded reasonably well.
- The real problem is reach: 62% of visits never got that far. Rewriting the button text would work on 38% of visitors at best.
The team adds the same button to the hero and keeps the one in pricing. In the following 30 days, again with 8,000 visits, the buttons receive 384 clicks:
- Clicks per visit: 384 ÷ 8,000 = 4.8%, up from 2.3%.
- Total clicks: (384 − 182) ÷ 182 = +111%.
- Clicks per visit that reached a button: 384 ÷ 8,000 = 4.8%, below the earlier 6.0%. That is expected: the hero button reaches everyone, including visitors who are less ready.
This is a before-and-after comparison, not a controlled test, so check that traffic sources and the mix of weekdays were similar in both periods before crediting the layout. The chart after this section shows the scroll reach by section.
Share of visits reaching each section · landing page
8,000 visitsMobile layout
Mobile layouts are not shrunken desktop layouts. Every multi-column type collapses into one column, so the order of the stack becomes the layout. Designing mobile-first, deciding the phone order before the desktop grid, avoids burying the call to action under a tall image.
Checks for a mobile layout:
- Stacking order. When two columns collapse, which comes first? Usually the text and button, then the image.
- The first screen on a real phone. Measure what fits in about 390 by 700 CSS pixels after the browser bars.
- Tap targets. WCAG 2.2 sets a minimum target size of 24 by 24 CSS pixels, with some exceptions; buttons people use often should be larger.
- Sticky elements. A sticky header or call-to-action bar helps on long pages, but every sticky pixel is taken from the content.
- Layout shift. Images without dimensions, late banners and web fonts move content while people try to tap, which shows up as poor cumulative layout shift.
Then check scroll reach by device separately. A section reached by 60% of desktop visits may be reached by 35% of phone visits, because the same content is much taller on a narrow screen.
How to validate a layout change
Use the same evidence before and after the change:
- Click map. Where do people click, and do they click things that are not links? A heatmap, and specifically a click map, shows clicks aggregated across visits. How to avoid misreading one is covered in how to read a heatmap.
- Scroll reach. What share of visits reach each section? Set it up as in tracking scroll depth.
- Session replays, a handful of them, to see the confusion behind the numbers, such as a visitor hunting for the price.
- The outcome metric: clicks on the primary action, sign-ups or purchases per visit, split by device.
- A fair comparison: the same number of days, the same weekdays, and similar traffic sources on both sides of the change.
If you can run an A/B test with a testing tool, that is a stronger comparison than before and after. Either way, decide in advance what result would make you keep the change.
How to check a layout in TapCub
Here is the landing-page example as you would work it through in TapCub.
- Turn on the inputs. Heatmaps need autocapture, which is on the Pro plan and above. In Web analytics › Configuration › SDK code, open the autocapture card, switch it on and switch on Scroll depth, which is off by default. No code change is needed.
- Read scroll reach and clicks. In All-platform analytics › Behavior › Heatmaps, pick the landing page. The page list shows clicks, rage clicks, sessions and average maximum scroll depth. The Scroll reach tab shows the share of visits reaching each depth (the 38% at the pricing section in the example), Clicks and Elements show what gets clicked, and you can filter by device: desktop, mobile or tablet.
- Start from entry pages. Web analytics › Pages has an entry pages tab; from a row you can open the click map for that path and date range, so you start with the pages visitors actually land on.
- Watch a few sessions. All-platform analytics › Behavior › Session replay is off by default; an admin or owner turns it on with a sample rate (10% by default) and input masking kept on.
- Compare before and after. TapCub does not run A/B tests. The heatmap has no compare-period option, so open the same page for the 30 days before and the 30 days after the change, up to 92 days per range, and note the release in Configuration › Annotations.
How to create a heatmap covers the setup screen by screen.
FAQ
What are the main types of website layout?
The common types are single column, Z-pattern, F-pattern or text-heavy, card or grid, split screen, magazine and sidebar. Each suits a different job: single column for focused reading and mobile, cards for browsing many similar items, split screen for an either/or choice, sidebar for documentation and filters. Choose from the page's task, then check with click and scroll data.
What is a good layout for a website?
One that answers the visitor's questions in the order they ask them. The first screen should say what the page is, why it matters to this visitor and where to click next, with one primary call to action. Later sections follow the visitor's decision steps. Whether it works shows in scroll reach and clicks on the main action, not in how it looks in a mock-up.
What should be above the fold on a website?
A specific headline, one sentence on the main benefit, one primary call to action, a visual of the actual product and, if you have it, short proof such as a sourced number or a customer quote. NN/g's 2018 data found 57% of viewing time on the first screenful, so put decision-critical content there and check the real first screen on a phone.
Is the F-pattern a layout I should use?
Not as a template. NN/g describes the F-pattern as what happens when people scan text that has little formatting for the web, and recommends breaking it with clear headings, front-loaded key words, short paragraphs, bullets and bold terms. Use it as a reason to structure text pages well, and lay out the page so key information sits where scanning eyes land.
How do I know if my website layout is working?
Measure what visitors do on the page. Scroll reach shows which sections people actually see, a click map shows what they click, and a few session replays show where they hesitate. Then track the outcome, such as clicks on the main action per visit, by device. In the sample, a button reached by only 38% of visits was the problem, not its wording.
See also: Best Homepage Design: There Is No Single Best, So Test Yours With Data.
See also: About Us Page Examples: What to Write, With Five Business Types.
Sources
- F-Shaped Pattern For Reading Web Content (original eyetracking research), Nielsen Norman Group, 2006
- F-Shaped Pattern of Reading: Misunderstood, But Still Relevant, Nielsen Norman Group, 2017
- Scrolling and Attention, Nielsen Norman Group
- Understanding Success Criterion 2.5.8: Target Size (Minimum), W3C WAI
Was this article helpful?
We use your answers to fix and expand this page.
Couldn’t send. Please try again in a minute.
Thanks for the feedback. We’ll use it to improve this page.You’ve already sent feedback on this page. Thanks.

Product Experience Specialist
Writes about product experience, practical workflows, and growth, turning complex processes into clear steps for everyday decisions.