Try it on your own data
Every report in this article is in the free plan. One snippet for web and apps, up to 10 sites.
Start freeThere is no single best homepage design, because a homepage is judged by whether visitors reach what they came for. A good one shows a first-time visitor, within one screen, what the site is, what it does for them and where to click next. Test that with scroll reach, clicks and next-page data, not other people's examples.
What you will learn
- Judge a homepage by three questions answered in the first screen: what is this, what is in it for me, where do I click
- A call to action is capped by how many visits reach it: in the sample, 35% reached the button, so it got 1.75% of visits
- Judge a change by the outcome per visit: clicks doubled in the sample but sign-ups per visit rose 80%, from 0.70% to 1.26%
Why there is no single best homepage
Search for homepage design and you get lists of 15, 25 or 31 admired examples. They are useful for ideas and useless as a verdict, because a homepage is judged by one thing: whether the people who arrive on it get to what they came for. A bank, a ballet company and a software tool send visitors to different places, so the same layout cannot be best for all three.
What can be measured is function. Baymard Institute benchmarked the homepages of top US e-commerce sites in late 2020 and found problems that have nothing to do with taste: 62% of sites did not help visitors pick a well-defined starting scope, 43% did not make clickable elements and their hit areas clear, and 22% did not make the search field prominent. Those are routing failures, and routing can be checked in your own data.
Use one test. Within the first screen, a first-time visitor should be able to answer three questions: what is this, what does it do for me, and where do I click next? The rest of this guide breaks a homepage into parts, shows what data tests each, and works one example through with numbers.
The six parts of a homepage
Every homepage, whatever its style, is made of six parts. A part can be missing, but then something else has to carry its job.
- Value proposition. The headline and one supporting line. Job: answer "what is this and what does it do for me" without jargon.
- Primary call to action. The one next step you most want. Job: answer "where do I click".
- Navigation. Menu, search and, where it fits, a way to pick a scope such as a product line or audience. Job: get people with a different goal to their own page.
- Proof. Customer names or quotes, sourced numbers, certifications. Job: reduce the risk of trying you. Only use claims you can back with a source.
- Explanation or product view. A real screenshot, a short "how it works", or a few benefits. Job: make the offer concrete enough to act on.
- Secondary paths. Cards for other audiences, a blog teaser, the footer and the login link. Job: serve visitors who are not your main target without competing with the primary action.
The table below pairs each part with the data that tests it. The red flags are examples; set your own before you look at the data.
| Homepage part | Question it answers | Data to check | Example red flag (set your own) |
|---|---|---|---|
| Value proposition | What is this and what does it do for me? | Share of visits that leave after the homepage; a five-second test with five people | A quarter or more of visitors leave and the five-second test fails |
| Primary call to action | Where do I click? | Share of visits that reach it; clicks ÷ those who saw it | Reached by under half of visits |
| Navigation | Can I get to my page? | Clicks per menu item; next-page table | A page you rely on gets almost no clicks |
| Proof | Can I trust this? | Scroll reach to the proof; paths from it to pricing or sign-up | Few visitors reach it before the decision step |
| Explanation or product view | What exactly do I get? | Clicks on its links; next-page rates | Heavy clicks on a visual that is not a link |
| Secondary paths | Is there something for me? | Next-page share by path; login share separated | A secondary path outdraws the primary action 2 to 1 |
Red flags are illustrations; decide your own thresholds before you look at the data and split every number by device.
What to check in the first screen
Attention falls steeply down a page. Nielsen Norman Group's 2018 eyetracking study (120 participants, over 130,000 fixations, a 1920 by 1080 screen) found that people spent 57% of their viewing time above the fold and 17% on the second screenful, so the first two screens held 74%. Even if your audience behaves differently, the direction is clear: the value proposition, the primary call to action and navigation belong in the first screen, and the first screen is the part of the page you should test hardest.
Three checks use data you probably already collect:
- Does the first screen carry the primary action? If the main call to action only appears in the third screen, the share of visits that reach it caps its clicks. Read it from scroll reach.
- Do first clicks land where you intend? Rank the clicked elements in the first screen. If the secondary link outdraws the primary button two to one, the hierarchy is wrong.
- Is the first screen understood? Data tells you what people did, not what they understood. Pair it with a quick test: show the page to five people for five seconds and ask what the site does. If they cannot say, no click rate will fix the headline.
For layout and above-the-fold detail that applies to any page, see website layout; this guide is specifically about the homepage's job of routing people.
What the homepage does: routing visitors
A homepage is a junction, so the most useful report is where visitors go next. Sample data: 10,000 homepage sessions and what each did after the homepage.
| Next step | Sessions | Share |
|---|---|---|
| Features page | 2,100 | 21.0% |
| Pricing page | 1,400 | 14.0% |
| Blog | 800 | 8.0% |
| Login | 900 | 9.0% |
| Sign-up page (via the main button) | 175 | 1.75% |
| Other pages | 1,125 | 11.25% |
| Left after the homepage | 3,500 | 35.0% |
Three readings follow from this table, each a rule you can apply to your own:
- If a path you do not push is bigger than the one you do, the page promotes the wrong thing. Here 21% go to Features while 1.75% take the sign-up button.
- If login is a large share, split it out. The 9% who log in are existing customers; leaving them in the denominator makes the homepage look weaker at winning new visitors than it is.
- If the exit share is large, ask by device and by source. A 35% exit is meaningless on its own and a signal when it is 20% on desktop and 45% on mobile, or when it jumps for one campaign.
Worked example: moving a call to action into the first screen
Sample data: a software homepage with 10,000 visits in 30 days, 4,000 on desktop and 6,000 on mobile. The "Start free" button, the only primary action, sits in the third screen, under the benefits and the proof.
| Visits | Reach the third screen | Clicks on the button | Click rate, those who saw it | |
|---|---|---|---|---|
| Desktop | 4,000 | 50% = 2,000 | 140 | 7.0% |
| Mobile | 6,000 | 25% = 1,500 | 35 | 2.3% |
| All | 10,000 | 35% = 3,500 | 175 | 5.0% |
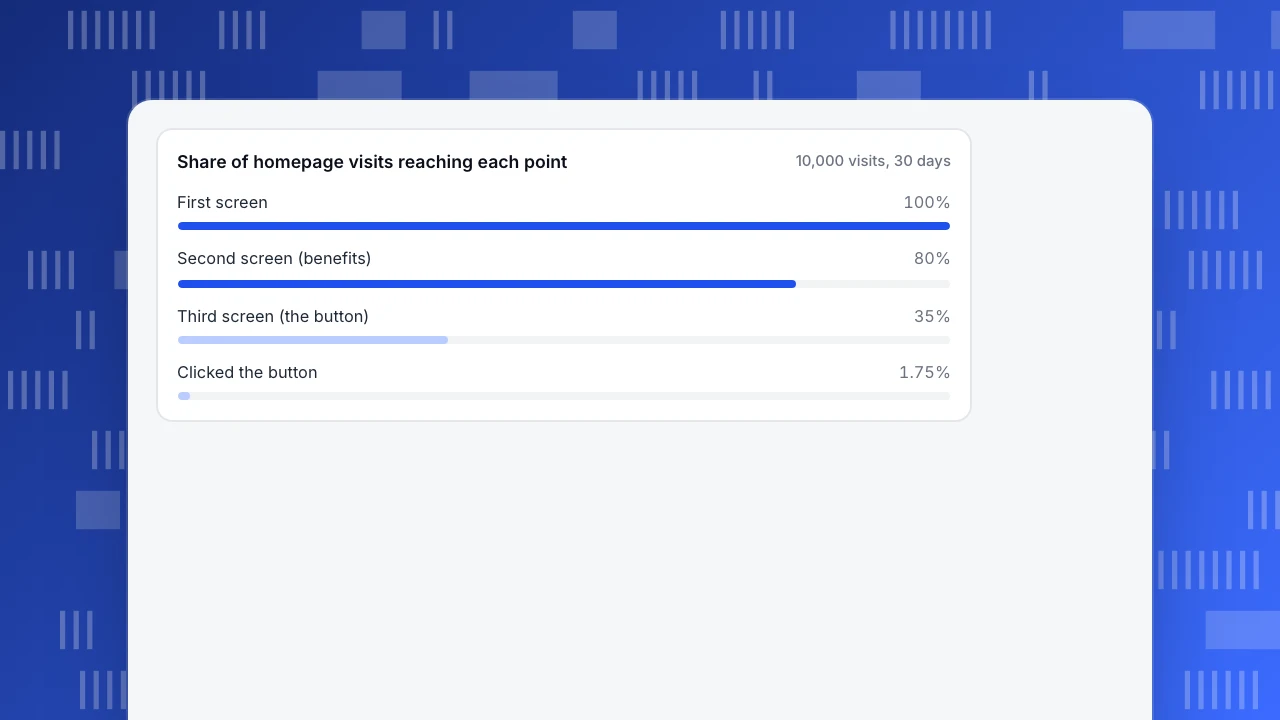
Reach to the second screen, where the benefits start, is 92% on desktop (3,680) and 72% on mobile (4,320), 80% overall (8,000 of 10,000). Reach to the third screen, where the button is, is 35%. The click rate is 175 ÷ 10,000 = 1.75% of visits and 175 ÷ 3,500 = 5.0% of visits that saw the button, so people who see it click it. The rate is capped by how few see it, and mobile is hit hardest: 25% reach it.
The change: put a copy of "Start free" in the hero and keep the lower one. In the next 30 days (again 10,000 visits, same split) the hero button gets 350 clicks: 200 on desktop (5.0% of 4,000) and 150 on mobile (2.5% of 6,000). The click rate rises from 1.75% to 3.5%.
Do not stop at clicks. Of the 175 clickers before, 70 completed sign-up (40.0%); of the 350 after, 126 did (36.0%). The extra clickers are less committed, so the click-to-sign-up rate fell, but sign-ups per 10,000 visits rose from 70 to 126, from 0.70% to 1.26%. A two-proportion test gives z ≈ 7.7 for the click rate and z ≈ 4.0 for sign-ups per visit, both well beyond chance. The judgement is on sign-ups per visit, the outcome, and not on clicks.
Share of homepage visits reaching each point
10,000 visits, 30 daysHow to compare a homepage before and after a change
Homepage changes are easy to misjudge, because traffic mix shifts all the time. Four habits keep the comparison honest:
- Compare rates per visit, not counts. Clicks and sign-ups rise and fall with traffic. Divide by homepage visits.
- Use equal windows that start on release day. Thirty days before and thirty days after, with no part of the old layout in the "after" range.
- Look at a guardrail beyond the target. The target is clicks on the new button. The guardrails are sign-ups per visit and next-page rates, so you notice if you won clicks but lost the reader.
- Note what else changed. A campaign, a price change or a holiday can move a homepage as much as your edit. Mark the release and the campaign on the timeline.
A before-and-after on two periods is not an experiment. If the stakes are high, run a proper split test in a tool built for it, and use your analytics to confirm the result.
Common homepage mistakes
- Copying someone else's homepage. Their traffic, offer and audience are not yours. Use examples to generate options and your data to choose.
- Putting everything above the fold. Six messages in the first screen means none is read. One value proposition and one primary action beats a crowded hero.
- Using a carousel to avoid choosing. Baymard found only 36% of the sites in its benchmark used carousels and 75% of those implemented them incorrectly; if you use one, check clicks per slide to see whether anyone gets past the first.
- Reading an overall average. A blended rate hides a desktop-versus-mobile gap like the 7.0% against 2.3% above. Split by device first.
- Judging by bounce rate alone. A visit that leaves after the homepage may have found the phone number it needed. Judge by the routing table and outcomes.
- Changing many things at once. Move the button, rewrite the headline and swap the hero image together, and you will not know which one worked.
How to check a homepage in TapCub
Here is the example worked through in TapCub. TapCub measures what visitors do; it does not run A/B tests.
- Switch on the inputs. Heatmaps need autocapture (Pro plan and above). In Web analytics › Configuration › SDK code, turn on autocapture and switch on Scroll depth, which is off by default.
- Read reach and clicks by device. In All-platform analytics › Behavior › Heatmaps, pick the homepage and then desktop or mobile. Scroll reach shows the share of visits reaching each depth (the 80% and 35%), and Elements shows the most clicked controls with their share and visitors, so you can see whether the hero button or the secondary link wins. The page list also shows rage clicks.
- See where people go next. In All-platform analytics › Behavior › Behavior analysis, open paths: forward direction, starting at the homepage path, counting sessions. Each step shows the most frequent next pages, and forward paths also show the drop-off, which is your "left after the homepage". How to analyze user paths covers the settings.
- Check the outcome. Build a funnel from the homepage path to the sign-up page path to the completed sign-up. Each step shows its count and rate, which gives the 40.0% and 36.0%. How to build a funnel has the steps.
- Compare before and after. The heatmap has no compare-period option and neither does the funnel: run each for the 30 days before and the 30 days after, up to 92 days per range, and record the release in Configuration › Annotations. To watch a few real visits, open Session replay, which is off by default and which an admin turns on. See how to read a heatmap and landing page analytics for related methods.
FAQ
What makes a good homepage design?
A good homepage lets a first-time visitor tell within one screen what the site is, what it does for them and where to click next, then routes each kind of visitor to the right page. You can verify it with data: scroll reach, clicks on the primary action, next-page rates and sign-ups per visit, split by device.
What should be on a homepage?
Six things: a value proposition, one primary call to action, navigation, proof you can source, a concrete explanation or product view, and secondary paths for other audiences. If a part is missing, another part must do its job. Order them by the visitor's questions, not by your org chart.
How do I know if my homepage is working?
Check four things: how many visits reach the part holding the primary action, the click rate among those who saw it, where visitors go next, and whether the outcome, such as sign-ups per visit, improves after a change. Split every number by device. A homepage works when it moves the right visitors to the next step.
What is the most important part of a homepage?
The first screen, because it is where most attention goes. Nielsen Norman Group's 2018 study found 57% of viewing time above the fold. The value proposition, the primary action and navigation belong there. Everything below supports visitors who want more before they decide.
Should a homepage have a carousel?
Only if you can show that people use the later slides. In Baymard's benchmark of top US e-commerce sites, 36% used carousels and 75% of those implemented them incorrectly. Check clicks per slide: if almost all clicks land on slide one, the other slides are not earning their space.
Sources
- Scrolling and Attention, Nielsen Norman Group, 2018 (57% and 17% of viewing time; 120 participants)
- Homepage UX: 8 Common Pitfalls & Best Practices, Baymard Institute, 2021 (late-2020 benchmark of top US e-commerce homepages)
Was this article helpful?
We use your answers to fix and expand this page.
Couldn’t send. Please try again in a minute.
Thanks for the feedback. We’ll use it to improve this page.You’ve already sent feedback on this page. Thanks.

Data Engineer
Writes about event design, data quality, and collection workflows, with verifiable implementation methods for reliable analytics.