Try it on your own data
Every report in this article is in the free plan. One snippet for web and apps, up to 10 sites.
Start freeA business dashboard is a single view of the few numbers a team uses to decide what to do next. It works when it is built around one decision, not a metric list: each block answers one question, shows a comparison and says what to do when it moves. Arrange the numbers in three layers: north star, drivers and diagnostics.
What you will learn
- Build around one decision: each block answers one question, carries a comparison and has a rule and an owner
- Use three layers: one north star, three to five drivers that multiply to it, and diagnostics opened only for the driver that moved
- Back-test the rules on the last eight weeks: in the sample week the north star fell 16.0% and two layers pinned it on paid social
What is a business dashboard, and what is it not?
A business dashboard is a single view of the few numbers a team uses to decide what to do next. Wikipedia describes a dashboard as a graphical interface that gives at-a-glance views of key performance indicators tied to a particular objective or business process. The words that matter are "at a glance" and "objective": a dashboard monitors, and it monitors something specific.
It is easy to confuse with two other things, and the confusion is behind most bad dashboards.
| Dashboard | Report | Analysis | |
|---|---|---|---|
| Question | Is anything off, and where do I look? | What happened in this period? | Why did it happen? |
| Size | 5 to 10 numbers | Pages | As large as the question needs |
| Read | Weekly or daily, in minutes | Periodically | Once, for a specific question |
| Output | A decision to act or not | A record | An explanation |
When a dashboard tries to be a report, it grows to 40 tiles and nobody reads it. Keep the dashboard for monitoring and move exploration elsewhere. Lists of metrics by function are in analytics dashboard, KPI dashboard and small business dashboard; this guide is about how to build one around a decision.
Design around a decision, not a metric list
The dashboards that get read have five things in common, and each one is a design rule:
- One decision per dashboard. "Where should the growth team put its effort this week?" is a decision. "Everything about the business" is not.
- One question per block. A block that answers "is signup conversion holding?" is useful. A block labelled "Signups" that nobody can interpret is not.
- Always a comparison. A number alone has no meaning. Show last week, the four-week average or a target beside it.
- A rule and an owner for every block. Write what counts as a problem and who looks at it ("down 10% or more versus last week, the head of growth opens the drivers"). A block without a rule is decoration.
- Fits one screen. If it scrolls, readers stop at the first screen and the lower blocks are never seen.
These rules are why a dashboard built from "what we can measure" fails and one built from "what we decide" works: the second starts from the question and only then picks numbers.
The three layers: north star, drivers, diagnostics
Arrange the numbers in three layers, from the one you care about most to the ones that explain it.
| Layer | What it holds | How many | Question it answers |
|---|---|---|---|
| North star | The single number that captures value delivered | 1 | Is the business moving the right way? |
| Drivers | The inputs that multiply or add up to the north star | 3 to 5 | Which input moved? |
| Diagnostics | Breakdowns of one driver by channel, device, page or segment | As needed, hidden until needed | Where, specifically? |
Amplitude's North Star Playbook describes the north star as a single measure that aligns an organisation on the value its product delivers and ties daily work to long-term growth. Choose one that reflects delivered value rather than activity: activated accounts per week is more useful than page views. The drivers are best found with a metric tree, which breaks the north star into factors, and the north star metric entry covers how to choose it.
The layers make a dashboard readable in two minutes. Look at the north star; if it moved, look at the drivers to find which input changed; open diagnostics only for the driver that did.
An example dashboard layout
Here is a weekly growth dashboard for a software product, which can be adapted to other businesses. Every block has a question, an example rule and an owner. The thresholds are illustrations: set your own from your recent history.
The table in this section shows the layout. Notice what is absent: no vanity totals, no all-time numbers and nothing without a rule.
| Block | Layer | Question it answers | Example rule | Owner |
|---|---|---|---|---|
| Activated accounts per week | North star | Is growth moving the right way? | Down 10% or more vs last week: open the drivers | Head of growth |
| Visitors | Driver | Is demand holding? | Down 10% or more: check acquisition channels | Marketing |
| Signup rate | Driver | Do visitors turn into signups? | Down 0.3 points or more: open channel breakdown | Growth |
| Activation rate | Driver | Do signups reach the first value? | Down 3 points or more: review onboarding steps | Product |
| Signup rate by channel | Diagnostic | Which channel changed? | Down 1 point or more in any channel: check its landing page | Marketing |
| Signup funnel by step and device | Diagnostic | Where do people drop off? | Largest drop moves to a new step: investigate that step | Product |
| Errors on sign-up pages | Diagnostic | Is something broken? | Any rise vs last week: send to engineering | Engineering |
Thresholds are illustrations: set yours from your own last eight weeks, and give every block a named owner.
Worked example: reading one week in two minutes
Sample data: the growth team reads this board every Monday. It uses the layout above, the north star is activated accounts per week, and the drivers are visitors, signup rate and activation rate.
| Number | Last week | This week | Change |
|---|---|---|---|
| Visitors | 18,500 | 18,000 | −2.7% |
| Signup rate | 4.00% (740) | 3.50% (630) | −0.50 pts |
| Activation rate | 67.6% (500) | 66.7% (420) | −0.9 pts |
| Activated accounts (north star) | 500 | 420 | −16.0% |
The north star fell 16.0%, past the 10% rule, so the team opens the drivers. The three drivers multiply to the north star: 0.973 × 0.875 × 0.986 ≈ 0.840, which is −16.0%. Visitors changed by only −2.7% and activation by −1.3%, while signup rate fell 12.5% in relative terms (4.00% to 3.50%). The problem is signup conversion, not traffic. Now the diagnostics: signup rate by channel.
| Channel | Last week | This week | Signup rate | Change in signups |
|---|---|---|---|---|
| Organic search | 9,000 visits, 360 signups | 8,800 visits, 352 signups | 4.0% → 4.0% | −8 |
| 2,500, 150 | 2,400, 144 | 6.0% → 6.0% | −6 | |
| Paid social | 4,000, 140 | 4,400, 66 | 3.5% → 1.5% | −74 |
| Other | 3,000, 90 | 2,400, 68 | 3.0% → 2.8% | −22 |
| Total | 18,500, 740 | 18,000, 630 | 4.0% → 3.5% | −110 |
Paid social explains 74 of the 110 lost signups (67%), and it got more visits, not fewer: 4,400 against 4,000 with a rate of 1.5%. The three other channels are stable. The action the board points to is specific: check the paid-social landing page and the audience of that week's campaign. Two minutes, one meeting agenda.
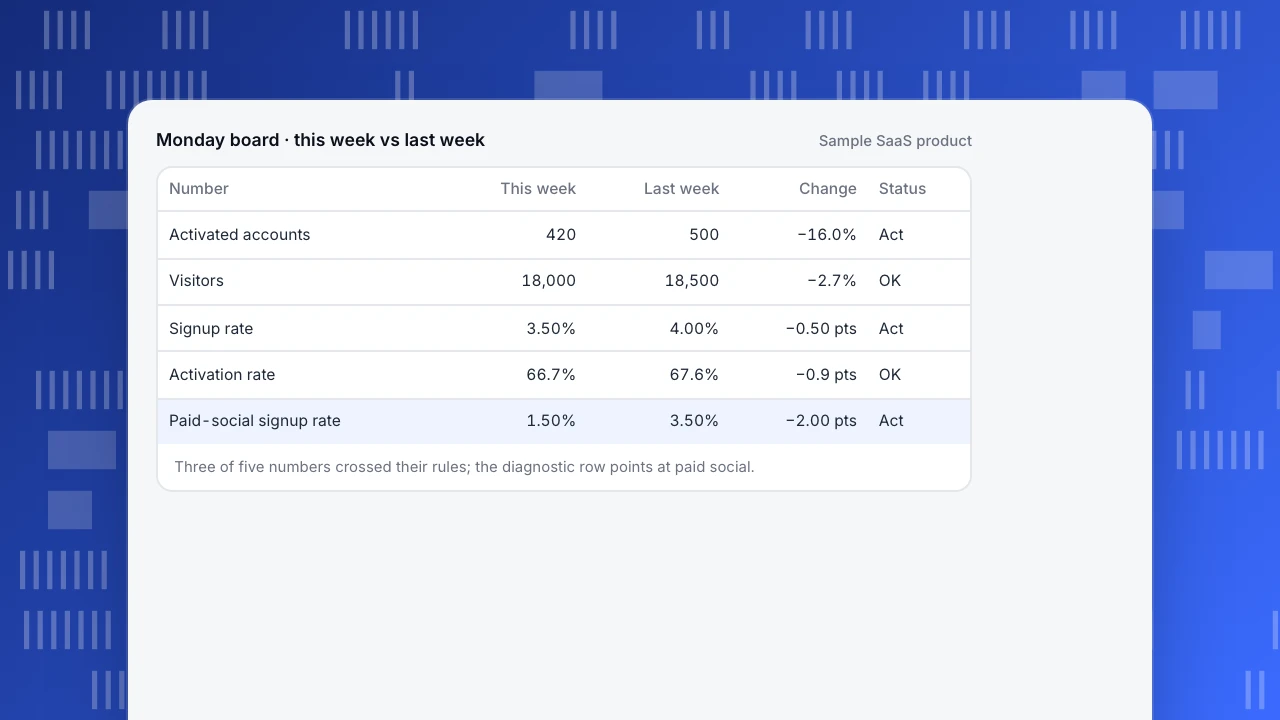
Monday board · this week vs last week
Sample SaaS product| Number | This week | Last week | Change | Status |
|---|---|---|---|---|
| Activated accounts | 420 | 500 | −16.0% | Act |
| Visitors | 18,000 | 18,500 | −2.7% | OK |
| Signup rate | 3.50% | 4.00% | −0.50 pts | Act |
| Activation rate | 66.7% | 67.6% | −0.9 pts | OK |
| Paid-social signup rate | 1.50% | 3.50% | −2.00 pts | Act |
Three of five numbers crossed their rules; the diagnostic row points at paid social.
How to build a business dashboard in four steps
- Name the decision and the meeting. Write one sentence: "Every Monday, the growth team decides where to put its effort." If you cannot name a meeting or a decision, you are building a report.
- Pick the north star, then the drivers. Draw the metric tree on paper: north star at the top, three to five factors below it. Choose drivers that multiply or add to the north star so changes can be explained.
- Add diagnostics last, and keep them out of sight. Pick the one or two breakdowns that you would use to explain a driver (channel, device, landing page) and put them below the drivers.
- Write the rule and owner, then back-test. For each block, write "act when" and name a person. Then look at the last eight weeks: would the rules have fired in the weeks you remember as problems, and stayed quiet in good weeks? If a rule fires every week, loosen it; if it never fired during a real problem, tighten it.
Common business dashboard mistakes
- Showing every metric you have. A dashboard of 40 tiles is a report. Keep the five to ten that map to a decision.
- Numbers without a comparison. "18,000 visitors" says nothing; "−2.7% versus last week" does.
- No owner. A block nobody is responsible for is never acted on.
- Mixing time ranges. A weekly conversion next to an all-time total invites wrong conclusions. Keep every block on the same window unless labelled.
- Vanity totals. Cumulative signups only go up. Use rates and per-period numbers.
- Treating the dashboard as the analysis. A dashboard tells you where to look. The explanation comes from drilling down, and it belongs in a saved analysis, not a bigger board.
How to keep a dashboard useful over time
Dashboards decay: a metric is renamed, a campaign ends, the product changes and a block stops meaning what it did. A short routine prevents it.
- Monthly, remove a block nobody used. If no one mentioned it in the last four meetings, take it off.
- Keep a definition note on the board. Next to each number, write in a line what it counts and from which events. Disputes about the data end faster.
- Retune the rules each quarter. Thresholds drift as the business grows: re-run the eight-week back-test and adjust.
- Review whether the decision still exists. If the Monday meeting stopped, the dashboard should stop too, or become a monthly one.
- Have one owner for the board itself. Without a person who owns the dashboard, it freezes.
How to build this dashboard in TapCub
Here is the Monday board from the example in TapCub. TapCub covers behavior and conversion numbers; finance and cash figures live in your own tools.
- Save each number as an analysis. In All-platform analytics › Behavior › Behavior analysis, build visitors and sign-ups as event analysis, signup to activation as a funnel, and signup rate by channel as a breakdown. Save each with a name, and the scene tree helps group them.
- Put them on a board. Open All-platform analytics › Overview › My dashboards. A card is a saved analysis, a text block or a divider; use a text block to write the rule and owner next to each number. The board has its own date range and filters, and you can set it as the default or pin it into the web or app shell. The number of dashboards depends on your plan.
- Start from a pack if you want a template. All-platform analytics › Business › Industry packs writes event definitions, metrics, funnels and dashboards in one go (the SaaS pack includes growth and adoption boards). You still send the events yourself.
- Alert on the north star only. In All-platform analytics › Operations › Monitors, add a monitor on a saved metric with a period-over-period rule, and use the dry run to see how often it would have fired in the last 30 days. Monitors only notify; they do not change anything.
- Send and share it. The weekly scheduled report (Configuration › Settings › Notifications) carries the web overview numbers such as visitors, sessions and conversions, not the board itself; to share the board, create a read-only link for people outside the project. A shared dashboard shows at most the last 90 days, and an admin or the owner turns sharing on. See share a dashboard and schedule email reports.
FAQ
What is a business dashboard?
A business dashboard is a single view of the few key numbers a team uses to decide what to do next, usually with a comparison and a rule for when to act. It monitors a specific objective rather than listing every metric, and it is read in minutes.
What should be on a business dashboard?
One north star number, three to five driver metrics that explain it, and diagnostics that break a driver down by channel, device or page. Every block should have a comparison, a rule for when it needs action and an owner. Cumulative totals and metrics with no decision attached do not belong.
How many metrics should a dashboard have?
Five to ten on the main screen: one north star and three to five drivers, with a few diagnostics. There is no magic number. The test is whether each block answers a question that leads to a decision, and whether the board fits on one screen without scrolling.
How do you build a business dashboard?
Name the decision and the meeting, pick the north star and its drivers from a metric tree, add one or two diagnostic breakdowns, then write a rule and an owner for each block and back-test the rules on the last eight weeks. Review it monthly and drop blocks nobody uses.
What is the difference between a dashboard and a report?
A dashboard answers "is anything off and where should I look?" in minutes, with 5 to 10 numbers read weekly or daily. A report records what happened in a period and runs to pages. Use the dashboard to spot a change and a saved analysis or report to explain it.
Sources
- Dashboard (business), Wikipedia (definition of a dashboard, classification and design guidelines)
- The North Star Playbook, Amplitude (the north star metric and related inputs)
Was this article helpful?
We use your answers to fix and expand this page.
Couldn’t send. Please try again in a minute.
Thanks for the feedback. We’ll use it to improve this page.You’ve already sent feedback on this page. Thanks.

Data Engineer
Writes about event design, data quality, and collection workflows, with verifiable implementation methods for reliable analytics.