Try it on your own data
Every report in this article is in the free plan. One snippet for web and apps, up to 10 sites.
Start freeCustomer satisfaction tools collect ratings at some moment, and the first choice is the metric, not the product: CSAT judges one interaction, NPS measures loyalty and CES measures effort. Timing matters more than the tool. Below: the tool types, how the three metrics differ, a worked month where they tell three stories, and how to choose.
What you will learn
- CSAT, NPS and CES answer different questions; choose the metric before the tool
- Ask close to the event: CSAT after support, CES after a task, NPS as a periodic check
- Read the three together, and add behaviour data to see what drove the scores
What customer satisfaction tools actually do
A customer satisfaction tool does up to four jobs: it asks a question at some moment, collects and stores the answers, helps you read them, and routes the unhappy ones to a person. Tools differ mostly in which of the four they do well and where they sit: in a chat window, in an email, on a page, or in a separate survey platform. They fall into a few types:
| Type | What it collects | Good for | Blind spot |
|---|---|---|---|
| Rating built into support (chat or help desk) | A score after a conversation | Judging agents and conversations | Says nothing about people who never contacted support |
| Survey platform | Any survey you design, by link or email | Relationship surveys, longer questionnaires | Low response rates; detached from the interaction |
| In-page or in-app widget | A short question at a point in the journey | Ease of a specific step | Only catches people who reach that step |
| Review and feedback pages | Public reviews and free-text comments | Reputation and themes | Skews to extremes; hard to count |
| Behavioural analytics | What people did (clicks, drop-offs, errors) | Seeing where friction is | Shows what happened, not how people felt |
The last row is not a satisfaction tool in the strict sense, but it matters: ratings tell you how people felt, behaviour tells you what drove it, and you need both to act.
CSAT, NPS and CES answer different questions
Before choosing a tool, choose the metric, because the three common ones measure different things.
| Metric | The question | Scale | How it is calculated | What it tells you |
|---|---|---|---|---|
| CSAT (customer satisfaction) | How satisfied were you with {this interaction}? | Usually 1–5 | Share of responses at the top of the scale (for example 4–5), or the average | How one interaction went |
| NPS (Net Promoter Score) | How likely are you to recommend us to a friend or colleague? | 0–10 | % promoters (9–10) minus % detractors (0–6); passives are 7–8 | Overall loyalty and word of mouth |
| CES (customer effort score) | A statement such as "{Company} made it easy to handle my issue" | Often 1–7 agreement | Average, or share who agree (for example 5–7) | How hard something was to do |
NPS comes from Fred Reichheld's 2003 Harvard Business Review article, and the question, scale and groups above are those published on the Net Promoter System site. CES grew from the argument, in a 2010 HBR article by Dixon, Freeman and Toman, that reducing customers' effort matters more than delighting them. Note the formulas are conventions: some teams report CSAT as an average, some as a percentage; pick one and keep it.
These are not interchangeable. A customer can be satisfied with a support chat (CSAT high), find the process hard (CES low) and still not recommend you (NPS low) because of price. A practical consequence: if you can only run one measure this quarter, run the one that matches the decision in front of you, not the one with the most familiar name.
| Metric | The question | Ask it when |
|---|---|---|
| CSAT | How satisfied were you with this interaction? (1–5) | Right after a support conversation or purchase |
| NPS | How likely are you to recommend us? (0–10) | Periodically, as a relationship check |
| CES | {Company} made it easy to handle my issue (agree 1–7) | Right after a task such as setup or checkout |
Pick one calculation method per metric and keep it.
Match the metric to the moment
Timing matters more than the tool. A question works when it asks about what just happened, close to when it happened.
| Moment | Metric | Why this one | When to ask |
|---|---|---|---|
| Right after a support conversation | CSAT | Judges that interaction | Straight away, or within a day |
| After completing a task (setup, checkout, a return) | CES | Measures how hard the task was | Right after the task ends |
| Regular check-in on the relationship | NPS | Measures overall loyalty, not one event | Every few months, not tied to a ticket |
| After a purchase arrives | CSAT or a one-line question | Judges delivery and product | When the customer has had time to use it |
Two rules follow. Do not ask NPS right after a support ticket: the answer measures the ticket, not the relationship. And do not ask the same person for all three at once; each extra question tends to lower the chance they answer any.
Worked example: three metrics, three different stories
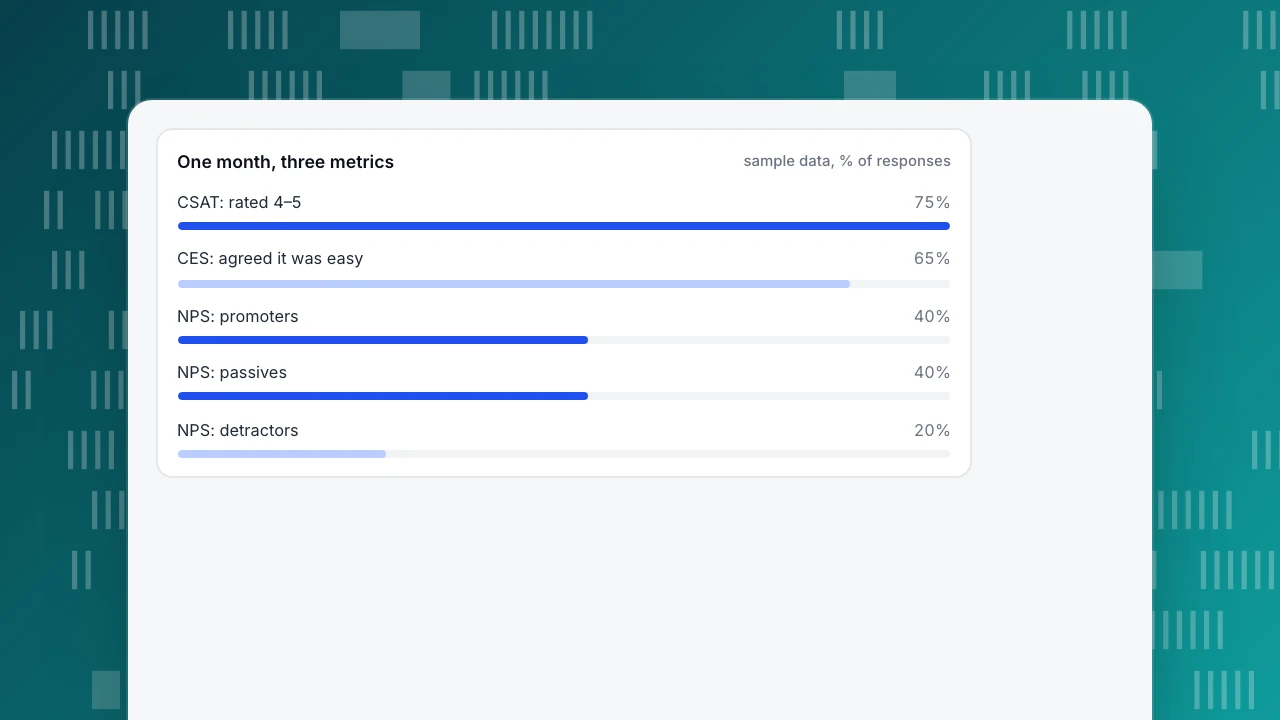
Sample data: a store looks at one month using three simple collection points.
| Metric | How collected | Responses | Result | Calculation |
|---|---|---|---|---|
| CSAT | 1–5 rating after chats | 400 of 2,000 chats | 75% | 300 rated 4–5; 300 ÷ 400 |
| NPS | 0–10 relationship survey | 250 | +20 | 100 promoters (40%) − 50 detractors (20%); 100 passives (40%) |
| CES | 1–7 agreement after checkout | 180 | 65% | 117 agreed (5–7); 117 ÷ 180 |
Reading the three together: support chats look good (75% satisfied), loyalty is moderate (NPS +20) and checkout feels harder than the chats suggest (only 65% say it was easy). The problem is not the agents; it is a step in the process. A team looking only at CSAT would conclude everything was fine.
Two caveats. The CSAT response rate is 400 ÷ 2,000 = 20%, so four in five chats were not rated, and the people who answer are not a random sample. And the three numbers use different scales, so do not average them or compare 75% to +20; compare each with its own previous period.
One month, three metrics
sample data, % of responsesWhat to look for in a tool
Without naming products, these are the questions that decide a good fit. Each has a rule you can apply:
| Question | If the answer is… | Then… |
|---|---|---|
| Can I control when the question appears? | No, only a fixed schedule | You cannot match the metric to the moment; look elsewhere |
| Is each score tied to a conversation or customer? | No, scores are anonymous averages | You can see the number but not fix the cause |
| Are low scores flagged for follow-up? | No | Add a manual routine, or the unhappy customer is never contacted |
| Does it run in the place customers already are? | Only by separate email link | Expect a low response rate; compare with an in-flow option |
| Can I export the data? | No | You cannot join it with orders or behaviour |
| What does it cost at my volume? | Priced per response or per seat | Check the number of responses you expect each month |
| What personal data does it keep, and where? | Unclear | Settle consent and retention before you launch |
If you only need to know how support conversations went, a rating inside your chat or help desk is usually enough; a separate survey platform becomes worthwhile when you need relationship surveys, longer questionnaires or many channels.
Common mistakes
- Choosing the tool before the question. Decide which decision the number will feed, then pick the metric, then the tool.
- Asking at the wrong moment. An NPS question after a refund request measures the refund.
- Reading the average and ignoring the low scores. Read the 1s and 2s one by one; that is where the cause is. The tactics are in improve CSAT.
- Treating a low response rate as unimportant. If one in five answers, the quiet four may feel differently. Track the response rate next to the score.
- Collecting scores and never closing the loop. A low score with no follow-up is a wasted signal; see customer success KPIs for how to tie it to retention.
- Never checking behaviour. Satisfaction scores tell you how people felt; see customer experience metrics for the wider set, and customer sentiment for how to read free text.
How to do this in TapCub
Use the three-metric example as the frame, and be clear about what TapCub does and does not cover. TapCub collects one satisfaction measure, the rating of each live chat, and it does not run NPS or CES surveys; for those you need a separate survey tool. What TapCub adds is the behaviour next to the rating.
- Collect the chat rating. After a conversation is resolved, the visitor can score it from 1 to 5 within 24 hours, once per conversation.
- Read the number in context. In Live chat › Reports, satisfaction is the average, to one decimal, with the change against the previous period. Note that TapCub reports an average, not the top-two-box percentage used in the example; you can compute the percentage yourself from the resolved conversations.
- Find the people behind low scores. In Live chat › Inbox › Resolved, read the conversations with 1 and 2. The visitor panel shows the source, current page and the last two days of browsing, so you see the journey.
- Compare agents and speed. The agent workload table shows each person's satisfaction, average first response, replies, transfers out and in. AI-only conversations are credited to the AI.
- Check whether chatting helps. Live chat › Reports › Conversion attribution compares goal conversion between visitors who chatted and those who only browsed. It does not prove cause, because visitors who chat tend to be nearer a decision, but it tells you whether chat is worth the effort.
- Look at the steps behind the scores. For the "checkout feels hard" kind of finding, the funnel in All-platform analytics › Behavior › Behavior analysis shows where people drop out. TapCub does not send the survey that asks why; it measures what they did.
FAQ
What are customer satisfaction tools?
Customer satisfaction tools ask customers a question at some moment, collect the answers, help you read them and flag the unhappy ones. They range from a rating inside chat or help desk to full survey platforms and in-product widgets. What matters most is which metric they collect and when.
What is the difference between CSAT, NPS and CES?
CSAT asks how satisfied someone was with a specific interaction, usually on 1–5. NPS asks how likely they are to recommend you, 0–10, and is promoters minus detractors. CES asks how easy something was. They answer different questions, so they are not interchangeable.
When should I ask for customer satisfaction?
Right after the experience you want to judge: a chat, a task, a delivery. Use CSAT after support, CES after a task, and NPS as a periodic check on the relationship, not straight after a ticket.
How do I calculate CSAT?
Divide the number of satisfied responses by all responses. If 4 and 5 count as satisfied, 300 of 400 gives 75%. Some teams report the average score instead; either is fine if you use one method consistently and say which.
Do I need a separate survey tool?
Not always. If you only want to judge support conversations, the rating in your chat or help desk is enough. Add a survey tool when you need relationship surveys (NPS), task-ease questions (CES) or longer questionnaires.
Sources
- Net Promoter System. Measuring Your Net Promoter Score: the recommend question, 0–10 scale, promoter / passive / detractor groups and the score formula. Checked 2026-11-18.
- Frederick F. Reichheld. The One Number You Need to Grow, Harvard Business Review, December 2003: origin of the Net Promoter Score. Checked 2026-11-18.
- Matthew Dixon, Karen Freeman and Nicholas Toman. Stop Trying to Delight Your Customers, Harvard Business Review, July–August 2010: the case for reducing customer effort. Checked 2026-11-18.
Was this article helpful?
We use your answers to fix and expand this page.
Couldn’t send. Please try again in a minute.
Thanks for the feedback. We’ll use it to improve this page.You’ve already sent feedback on this page. Thanks.

Product Analyst
Focuses on event analysis, conversion funnels, and retention, using clear metric definitions and structured analysis to explain product performance.