Try it on your own data
Every report in this article is in the free plan. One snippet for web and apps, up to 10 sites.
Start freeCustomer retention analytics measures who keeps coming back, who does not and at which stage the loss happens, so you can choose which group to save first. One overall retention rate cannot do that. In the worked example, an overall 26.4% at month 3 hides a range from 12% to 48%, and 81.5% of all losses happen in the first month. This guide shows the segment-by-stage view, how to find the cause and how to run it.
What you will learn
- Retention analytics answers 'which group first, at which stage', not 'what is our rate'; every number is one cell of a segment-by-stage table
- In the sample, the overall 26.4% at month 3 hides 48% (referral) against 12% (paid), and 81.5% of losses happen in month 1
- Rescue the cell with the most lost customers and a fixable cause: a ten-point gain on paid keeps 40 customers, the same gain on referral keeps 20
What is customer retention analytics, and what question does it answer?
Customer retention analytics is the measurement of who keeps coming back, who does not, and where in their lifetime the loss happens. The question it answers is not "what is our retention rate?" but "which group should we try to save first, and at which stage?" A single overall rate cannot answer that, because it averages groups that behave very differently and stages that fail for different reasons.
So the work has two cuts: segments (who) and stages (when). Every retention number in this guide is one cell of a segment-by-stage table, and the decision is picking the cell where the most customers are lost and the cause is fixable.
Why bother with retention at all? Harvard Business Review cites research by Frederick Reichheld of Bain & Company that raising the retention rate by 5% increases profits by 25% to 95%, and a commonly repeated range of 5 to 25 times as much to acquire a customer as to retain one. The same article notes the second range varies by study and industry and has no stated source, so use these as direction, not as a forecast for your business.
Which metrics sit under retention analytics?
Four numbers, all computed on a defined group over a defined window:
| Metric | Formula | Question |
|---|---|---|
| Retention rate | customers active in period N ÷ customers in the starting group | Who is still here? |
| Churn rate | 1 − retention rate (for the same window) | Who left? |
| Repeat rate | customers with 2 or more purchases ÷ customers with at least 1 | Do buyers come back? |
| Active days | days active per period, per customer | How deep is the habit? |
Define "active" before you compute anything: a purchase, a login, any meaningful action. Different definitions give different rates, and you cannot compare across definitions. For the metric definitions in full, see retention metrics; for the group-by-start-date view that produces these rates, how to do cohort analysis and customer churn analysis for the leaving side.
Why does the overall retention rate mislead? A worked example
Sample data: 1,000 customers who started in one month, split by how they were acquired. "Retained" means active in that later month.
| Segment | Customers | Month 1 retained | Month 3 retained |
|---|---|---|---|
| Organic | 400 | 45% (180) | 30% (120) |
| Paid | 400 | 25% (100) | 12% (48) |
| Referral | 200 | 60% (120) | 48% (96) |
| All | 1,000 | 40.0% (400) | 26.4% (264) |
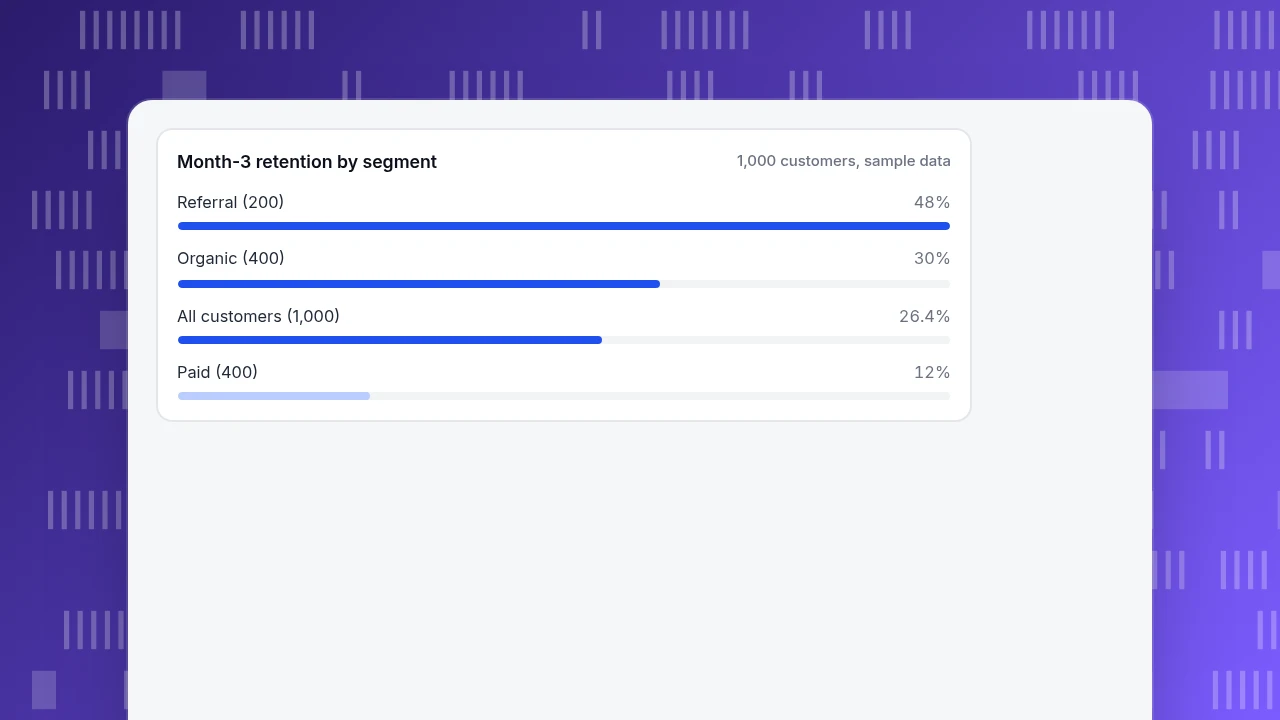
The overall month-1 rate is (180 + 100 + 120) ÷ 1,000 = 40.0%, and the month-3 rate is (120 + 48 + 96) ÷ 1,000 = 26.4%. A team reading only the bottom row sees "26.4% at month 3" and a vague mandate to do better. The segment rows show a more specific picture: referral customers retain at 48%, paid customers at 12%, a four-times difference that the average hides.
Now add the stage cut. Of the 1,000 starters, 600 are gone by month 1 (1,000 − 400) and 136 more by month 3 (400 − 264), so 736 are gone in total and 600 ÷ 736 = 81.5% of all losses happen in the first month. By segment, month-1 losses are: paid 300 (400 − 100), organic 220 (400 − 180), referral 80 (200 − 120), which sums to 600. Paid accounts for 40% of customers but 50% of the month-1 losses (300 ÷ 600).
That gives a rescue order: first, the early stage, since four out of five losses happen there; second, within it, the paid segment. A ten-point gain in paid month-1 retention (25% to 35%) keeps 400 × 0.10 = 40 more customers; the same ten points in referral keeps 200 × 0.10 = 20 more. Same effort, double the effect, because the segment is twice the size.
A rule you can reuse: for each cell, multiply the customers lost by how fixable the cause looks (0 to 1) and start with the highest product. Paid in month 1 has 300 lost and an onboarding gap rated 0.6, so 300 × 0.6 = 180; organic in month 1 has 220 lost with an unclear cause rated 0.3, so 66; referral in month 1 has 80 × 0.8 = 64. The ratings are judgement calls, but writing them down moves the discussion onto causes.
Month-3 retention by segment
1,000 customers, sample dataWhich segments should you compare?
Pick cuts that point to an action you could take:
| Cut | Example groups | What a gap suggests |
|---|---|---|
| Acquisition source | Organic, paid, referral, email | A source brings low-intent or mismatched customers |
| First product or plan | Starter plan, trial, first category bought | The entry point sets expectations badly |
| Customer type | New, returning, resurrected | Different lifecycle problems |
| Geography or device | Country, mobile, desktop | A local or technical fault |
| Value | Top spenders, average, low | Where the revenue is at risk |
Prefer cuts you can act on. "Customers born on a Tuesday" may produce a gap but suggests no fix. And keep segments large enough: a segment of 30 customers can swing ten points on a single person.
| Cut | Example groups | What a gap suggests |
|---|---|---|
| Acquisition source | Organic, paid, referral | A source brings mismatched customers |
| First product or plan | Starter plan, trial | The entry point sets wrong expectations |
| Customer type | New, returning, resurrected | Different lifecycle problems |
| Geography or device | Country, mobile, desktop | A local or technical fault |
Prefer cuts you can act on, and keep each segment large enough to trust.
Which stages should you compare?
A customer's life has stages with different failure modes:
| Stage | Window | Typical failure | Typical fix |
|---|---|---|---|
| Activation | Day 0 to 7 | Never completed the first useful action | Clearer onboarding, shorter path to first value |
| Early habit | Weeks 2 to 12 | Used once or twice, then drifted | Reminders, triggered messages, next-step prompts |
| Established | Month 3 onward | Stable, then lapsed (price, competitor, life change) | Loyalty, win-back, service recovery |
Match the window to your purchase rhythm. A weekly grocery order and an annual software renewal have different "early habit" lengths. In the example above, the first month is the activation and early-habit stage; the finding that 81.5% of losses sit there would send the team to onboarding, not to a loyalty programme.
How do you find the cause once you have the cell?
The table tells you where; behaviour tells you why. Four checks, cheapest first:
- Compare what retained and lost customers did early. Customers who did action X in the first week versus those who did not. The gap in retention between the two groups points at the habit-forming step. It is correlation, but it names a candidate.
- Walk the first-week funnel for the weak segment and find where it drops against a healthy segment.
- Look at the sessions of lost customers in a replay or timeline for friction: errors, dead ends, repeated clicks.
- Ask them. A two-question exit message or a conversation with a handful of lost customers is slow and small, and often the quickest way to learn something the numbers cannot show.
Then test a fix on the weak cell, measure that cell, and re-run the table next period.
How do you use predictions without trusting them too much?
Predictive scores that flag customers likely to leave are useful only if they change what you do. The test: what action would you take differently for a flagged customer? If the answer is "send the same email we would have sent anyway," the prediction adds nothing. Start with simple, explainable rules, such as no activity for 30 days after a 14-day habit, and check how many flagged customers were lost anyway; a rule with a high miss rate needs another input before it is worth automating.
Which mistakes make retention analysis misleading?
- Quoting the overall rate. The example shows four-times differences hidden inside a 26.4% average.
- Unequal windows. Month-3 retention of a January cohort and a December cohort are comparable only if each has completed its third month; a period that is not finished is not zero.
- Changing the definition of active mid-year, so the line moves with no behaviour change.
- Segments too small to trust. Ten customers in a cell can swing percentages wildly.
- Treating correlation as cause. Retained customers did X, but they may also have been more motivated from the start.
- Reading a rate without the count. 60% of 5 is not 60% of 500.
How to run this analysis in TapCub
Use the example: you suspect the paid segment is leaking in month 1.
- Define the start and return events. In All-platform analytics › Behavior › Behavior analysis, open Retention: pick an optional start event (for example, first purchase) and a return event; both empty means any activity. Choose day, week or month periods. Each row is a cohort with its size and a count and rate per period; a period that has not ended yet is empty, not zero.
- Build the segments. Create segments under All-platform analytics › Users › Segments & tags (rules on source or first product, for example) and apply them to the retention view; segments also carry into the funnel. For purchase-based groups, the RFM view in All-platform analytics › Business › Commerce & revenue shows champions, at-risk and about-to-sleep customers, with the change in each against 30 days earlier.
- Check lifecycle. The Lifecycle view in the same analysis splits people per week or month into new, returning, resurrecting and dormant, so you can see whether resurrecting customers are offsetting dormant ones.
- Find the early drop. Build a funnel for the first week for the weak segment; the largest drop is marked.
- Open a person. In All-platform analytics › Users › People (known users only, after
tapcub.login()), the profile shows a day-by-day timeline of what a lost customer did.
TapCub shows where customers drop and who they are. It does not send retention emails or run win-back campaigns; those happen in your own messaging tools.
FAQ
What is customer retention analytics?
It is the measurement of who keeps coming back, who does not and at which stage the loss happens, so you can choose which group to save first. It combines retention and churn rates with cuts by segment and lifecycle stage.
How do you calculate customer retention rate?
Divide the customers in a starting group who are still active in a later period by the number who started, for example 120 ÷ 400 = 30% for the organic group at month 3 in the sample. Define "active" first and keep the window fixed.
What are the best segments to analyse for retention?
Pick cuts that point to an action: acquisition source, first product or plan, customer type, device or country, and value tier. In the sample, source revealed a four-times gap (48% referral against 12% paid at month 3) that the 26.4% average hid.
How do you improve customer retention using analytics?
Find the segment-by-stage cell with the most lost customers, diagnose it with early behaviour and funnels, test a fix there and re-measure. In the example 81.5% of losses happened in month 1, so activation, not loyalty, was the first problem.
How is retention analysis different from churn analysis?
They are two views of the same data: retention counts who stays, churn counts who leaves. Retention analysis is organised by cohorts and segments over time; churn analysis often focuses on the causes and predictors of leaving.
Sources
- Gallo, A. The Value of Keeping the Right Customers. Harvard Business Review, October 2014 — Reichheld's 5% retention and 25% to 95% profit finding; the 5 to 25 times range and its caveat. Read 2026-11-19.
- Bain & Company. Retaining Customers Is the Real Challenge (2006) — the retention and profit relationship from Bain's own site. Read 2026-11-19.
Was this article helpful?
We use your answers to fix and expand this page.
Couldn’t send. Please try again in a minute.
Thanks for the feedback. We’ll use it to improve this page.You’ve already sent feedback on this page. Thanks.

Product Analyst
Focuses on event analysis, conversion funnels, and retention, using clear metric definitions and structured analysis to explain product performance.