Try it on your own data
Every report in this article is in the free plan. One snippet for web and apps, up to 10 sites.
Start freeTo collect user feedback, ask right after the person has finished a real task, using the method that fits your question, and then check what they said against what they did. Asking mid-task interrupts and lowers the response rate, and a rating from the few who answer says nothing about the silent majority. Below: the methods, the timing rule, a worked example and the traps.
What you will learn
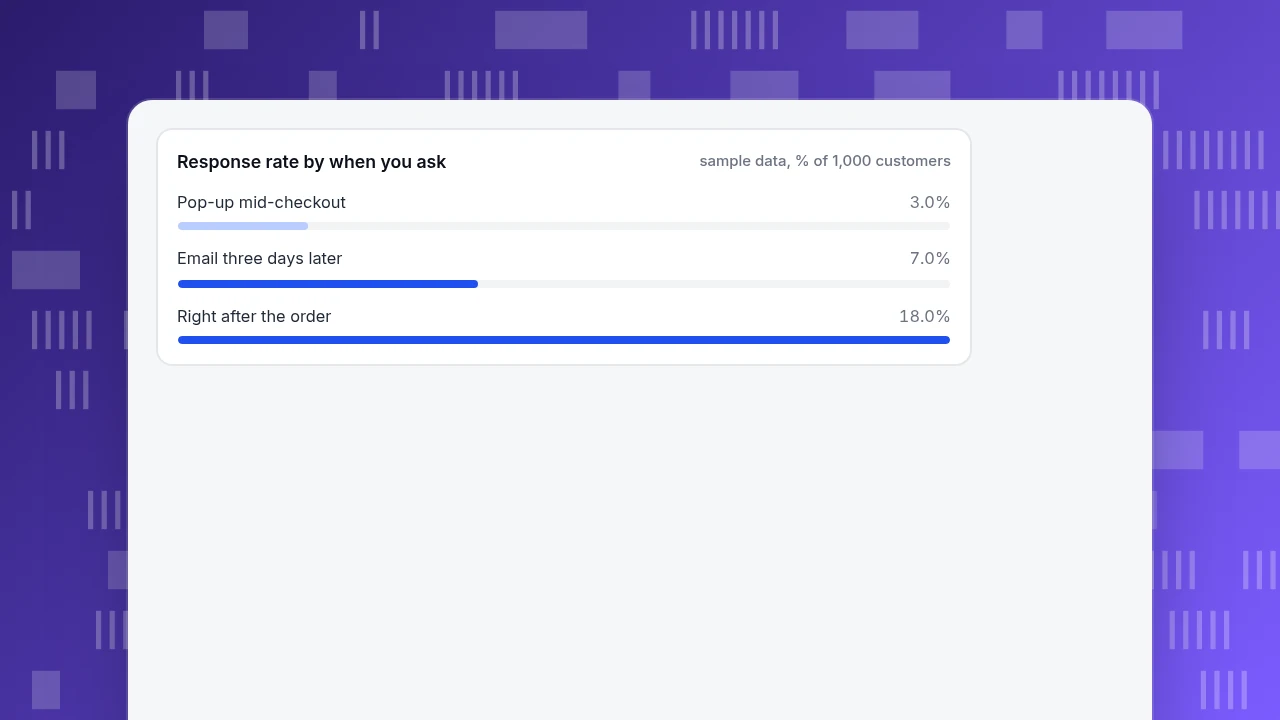
- Ask after the task is completed; in the sample, the same question got 18% responses after an order and 3% in a mid-checkout pop-up
- Match the method to the question: a rating for how a moment felt, support conversations for problems, behaviour data for where
- 46 ratings from 200 chats cover 23% of people; the true satisfaction figure could be anywhere from 17.5% to 94.5%
What counts as user feedback?
User feedback is anything users tell you about their experience with your product, support or site. It comes in two kinds that need different handling:
- Stated feedback: what people say. Ratings, survey answers, support messages, interview comments, reviews.
- Observed behaviour: what people do. Where they drop out of a funnel, what they click repeatedly, which pages they leave. It is not feedback in the strict sense, but it tells you whether the stated feedback matches reality.
Stated feedback explains why; behaviour shows where and how much. A rating of 2 out of 5 tells you someone was unhappy; a funnel tells you that 40% of people never get past the shipping step. You need both, and the rest of this guide is about collecting the first kind at the moment it is most useful and checking it against the second. If your question is what to put in a survey, that has its own guide: feedback questions.
Which method fits which question?
Pick the method from the question you are trying to answer, not from the tool you already own.
| Method | Best asked when | What you learn | Main limit |
|---|---|---|---|
| In-product rating (one question) | Right after a task is completed | How a specific moment felt | Few words; self-selected responders |
| Short survey (3–5 questions) | After a milestone (first order, onboarding done) | Reasons behind a score | Falls off fast beyond about one minute |
| Support conversations | Whenever customers write in | Real problems in their own words | Only people who bothered to ask |
| Interviews | Before a build or after a surprising result | Context and motives | Small numbers, time-consuming |
| Usability test | Before launch, or when a flow underperforms | Where people get stuck | Lab tasks, not real use |
| Behaviour data (funnels, heatmaps, replays) | Continuously | What people actually do, at scale | Tells you where, not why |
| Open channel (feedback link, offline message) | Always on | Problems you did not think to ask about | Unstructured; volume is low |
No single row is enough. A common pattern is behaviour data to find the step, support conversations and a rating to hear the reasons, and a few interviews to test the explanation.
| Method | Best asked when | What you learn | Main limit |
|---|---|---|---|
| In-product rating | Right after a task is completed | How a specific moment felt | Few words; self-selected responders |
| Short survey (3–5 questions) | After a milestone | Reasons behind a score | Falls off beyond about one minute |
| Support conversations | Whenever customers write in | Real problems in their own words | Only people who asked |
| Interviews | Before a build or after a surprise | Context and motives | Small numbers |
| Usability test | Before launch or when a flow underperforms | Where people get stuck | Lab tasks |
| Behaviour data | Continuously | What people actually do | Where, not why |
| Open channel | Always on | Problems you did not ask about | Unstructured, low volume |
Combine at least one stated source with one behavioural source.
When should you ask for feedback?
Ask after the person has finished something, not during it. Nielsen Norman Group's guidance on feedback requests gives this as its first rule: wait until users complete a real task, because early pop-ups interrupt the task and produce low-quality responses; keep the prompt subtle and offer an always-available feedback option as well (source). The same guidance says to keep surveys short, about one minute, and to state the number of questions up front.
In practice, tie the request to an event, not a timer:
- Order confirmed or payment completed: ask about checkout.
- Chat resolved: ask how the conversation went.
- Export, report or setup finished: ask whether it did what they wanted.
- Onboarding step completed: ask what is still unclear.
- Cancellation or exit flow: ask why, once, with a short list of reasons.
Sample data: a store tests three ways of asking the same one-question rating, each shown to 1,000 customers.
| When asked | Responses | Response rate | Notes |
|---|---|---|---|
| Pop-up in the middle of checkout | 30 | 3.0% | 22 of 30 were complaints about the pop-up or the delay |
| Right after the order confirmation | 180 | 18.0% | Mostly about checkout and delivery |
| Email three days later | 70 | 7.0% | More about the product; weak memory of checkout |
Sample data only, but the shape is the point: the same question gets six times the answers when it is asked after the task, and the answers are about the thing you wanted to learn.
Response rate by when you ask
sample data, % of 1,000 customersHow many responses do you need?
It depends on what you want to do with the answers.
For finding problems, a few people is enough. Nielsen Norman Group's model says the number of problems found with n users is N × (1 − (1 − L)ⁿ), where L is the share of problems one user reveals, about 31% in their projects (source). Computed: 1 user finds 31%, 3 users 67%, 5 users 84%, 10 users 98% and 15 users 99.6%. The recommendation is several small rounds of about five users, fixing between rounds, rather than one big study.
For measuring a rate, you need more. A satisfaction percentage from 46 responses has a wide margin: at 76% satisfied, the normal-approximation 95% interval is about ±12 points (64% to 88%). Do not report a one-point change in a number built on 46 answers.
For finding out what to build, count how many separate people mention the same problem, not how loudly one person says it.
Worked example: what 46 ratings out of 200 tell you
Sample data: a support team resolved 200 chat conversations in a month and received 46 ratings on a 1–5 scale.
| Score | 1 | 2 | 3 | 4 | 5 | Total |
|---|---|---|---|---|---|---|
| Count | 2 | 3 | 6 | 15 | 20 | 46 |
- Response rate: 46 ÷ 200 = 23%.
- Average score: (1×2 + 2×3 + 3×6 + 4×15 + 5×20) ÷ 46 = 186 ÷ 46 = 4.04.
- Share of 4s and 5s: (15 + 20) ÷ 46 = 76.1%, with a 95% interval of about 64% to 88%.
Now the part that is easy to miss. The 154 people who did not respond are not in these numbers. If every one of them was dissatisfied, only 35 of 200 were satisfied: 17.5%. If every one was satisfied, it would be (35 + 154) ÷ 200 = 94.5%. The data cannot tell you where in that range the truth is. What you can say is "among people who chose to rate, 76% were satisfied". To learn about the silent majority, you have to look at what they did instead: did they write again within a week, did they leave, did they buy.
That is why a rating works best as one input next to behaviour, not as the whole picture.
What should you do with feedback once you have it?
Feedback that is only collected does not change anything. A lightweight loop:
- Tag each item with one theme (checkout, delivery, setup, pricing, a feature) when it arrives.
- Count themes by number of people, weekly. Ten people mentioning shipping cost outweighs one long complaint about an edge case.
- Check each top theme against behaviour. If shipping cost is the top theme, does the funnel show the drop where costs appear? If yes, you have a cause and a place; if not, the loudest complaint may not be the biggest problem. For finding that place, see user friction.
- Fix one thing and say so. Tell the people who raised it. A short "you asked, we changed" message makes the next request more likely to get answered.
- Re-measure the same score after the change, with enough responses to see a difference.
To raise a satisfaction score in particular, see how to improve CSAT; the CSAT calculator does the arithmetic.
What mistakes make feedback misleading?
- Asking mid-task. It interrupts the person, lowers the response rate and tilts the answers toward annoyance, as the sample showed.
- Treating responders as everyone. 46 of 200 is 23%; the other 77% are unknown, not satisfied.
- Long surveys. Past about a minute, completion falls and the people who finish are not typical.
- Leading questions. "How great was our support?" gets different answers from "How was your conversation?".
- Asking the same people too often. Keep a cooling-off period, and ask only after meaningful moments.
- Collecting without a decision. Before sending, write down what you would change if the answer came back low.
- Ignoring quiet feedback. People who leave without saying anything are feedback too; read your drop-off data.
How do you collect feedback in TapCub?
Here is how a support-led team would collect it with TapCub, using the chat example above. TapCub covers chat satisfaction scores and behaviour data; it does not run surveys.
- Let the visitor score a resolved chat. When an agent clicks Resolve in Live chat › Inbox, the visitor can score the conversation from 1 to 5 within 24 hours. The score shows on the resolved conversation.
- Read the average and the change. Live chat › Reports shows satisfaction as an average to one decimal (one score per conversation), with the change against the previous period, and per agent in the workload table. If only the AI answered and no agent wrote before resolve, the score goes to the AI, not to a person. Counts per score, as in the example table, are yours to tally; the average alone cannot show a skewed split.
- Keep an always-on channel. Live chat › Chat settings › Offline messages lets visitors leave an email and a question when nobody is online; the status is New, Replied or Closed. Treat these messages as free-text feedback and tag them.
- Ask in context, where it fits. Live chat › Chat settings › Proactive invites can send a message after a visitor has spent a set number of seconds on a page, for example the order-confirmation page. It invites the visitor to chat, so decide who answers and use it for a few high-value moments, not for every visitor.
- Check what people do. All-platform analytics › Behavior › Behavior analysis funnels show where people drop out, and Heatmaps and Session replay (off by default) show what they did on that page.
TapCub does not do surveys (NPS or CES) or in-page rating widgets, so for those use a dedicated tool, and keep the behaviour check in TapCub.
FAQ
What is the best way to collect user feedback?
There is no single method; match it to the question. Use a one-question rating right after a task to measure how a moment felt, support conversations and open channels for problems you did not predict, interviews for motives, and behaviour data to see where people actually struggle. Combine at least one stated source with one behavioural source.
When is the best time to ask for user feedback?
Right after the user completes something real: an order confirmed, a chat resolved, a setup finished. Nielsen Norman Group advises waiting for task completion, because early pop-ups interrupt and produce low-quality answers. In the sample, asking after the order got 18% responses against 3% for a mid-checkout pop-up.
How many users do you need for feedback?
To find usability problems, about five users per round find roughly 84% of them, so run small rounds and fix between them. To measure a rate such as satisfaction, you need far more: 46 responses gives a margin of about ±12 points. Decide whether you want problems or a number before choosing a sample size.
How do you get honest feedback from users?
Ask after the task, keep it to about a minute, use neutral wording, and make it clear how the answer will be used. Offer an optional free-text box and an always-available feedback link. Then compare what people say with what they did; behaviour is the check on what is said.
What is the difference between user feedback and customer feedback?
User feedback is about using the product or site: usability, features, bugs. Customer feedback is wider and includes buying, delivery, support and price. The collection methods are the same; what differs is the moment you ask and who you ask, so a team often keeps both under one process.
Sources
- Nielsen Norman Group. User-Feedback Requests: 5 Guidelines: task first, then ask; keep surveys short; use flexible formats. Verified 2026-11-19.
- Jakob Nielsen. Why You Only Need to Test with 5 Users, Nielsen Norman Group: the problem-discovery formula and the 31% figure. Verified 2026-11-19.
Was this article helpful?
We use your answers to fix and expand this page.
Couldn’t send. Please try again in a minute.
Thanks for the feedback. We’ll use it to improve this page.You’ve already sent feedback on this page. Thanks.

Data Analyst
Explores traffic sources, conversion funnels, and retention, using clear metric definitions and concrete examples to explain what the numbers mean.